Community resources
Community resources
Community resources
5 tips to optimize the performance of your Confluence Data Center instance
Hey community,
I am Jacob Shepard and I am part of the Enterprise Marketing team. We know that many of you look to your Confluence instance(s) as mission-critical to both enable teamwork and store valuable information. As organizations scale, the importance of maintaining a highly performant instance grows exponentially, however, an increased load can cause performance issues if not managed appropriately. Confluence Data Center provides a variety of features and capabilities to help you optimize your instance's performance, continue to scale without issue, and ensure your organization can collaboratively accomplish work in an efficient and effective manner.
In this article, we are highlighting 5 tips to help ensure you and your team get the most out of a high-performing Confluence instance.
-
Plan and manage with Guardrails
-
Keep your site running like clockwork with application monitoring
-
Change logging levels in a cluster
-
Clean up historical data automatically
-
Leverage faster permission services
1. Plan and manage with Guardrails
Some of you may be concerned about your data growth and how it might impact your instance’s performance. To help you better plan and manage your instance, we introduced Guardrails for Confluence. Guardrails will help communicate the expected effects of growing data types, and provide you with the controls, insight, and capabilities you need to keep data in line.
At its core, Guardrails are product-based documentation and strategic recommendations designed to educate and help you avoid reaching a tipping point at which your Confluence instance might start to experience performance impacts.
The first version of published Guardrails is focused on the following data dimensions:
-
Index size
-
Spaces
-
Space size (for import)
-
LDAP users and groups
These guardrails will help you identify and mitigate scale risks by enabling you to make informed decisions about when, how and where to clean up your instance.
For more information on Guardrails go here.
2. Keep your site running like clockwork with application monitoring
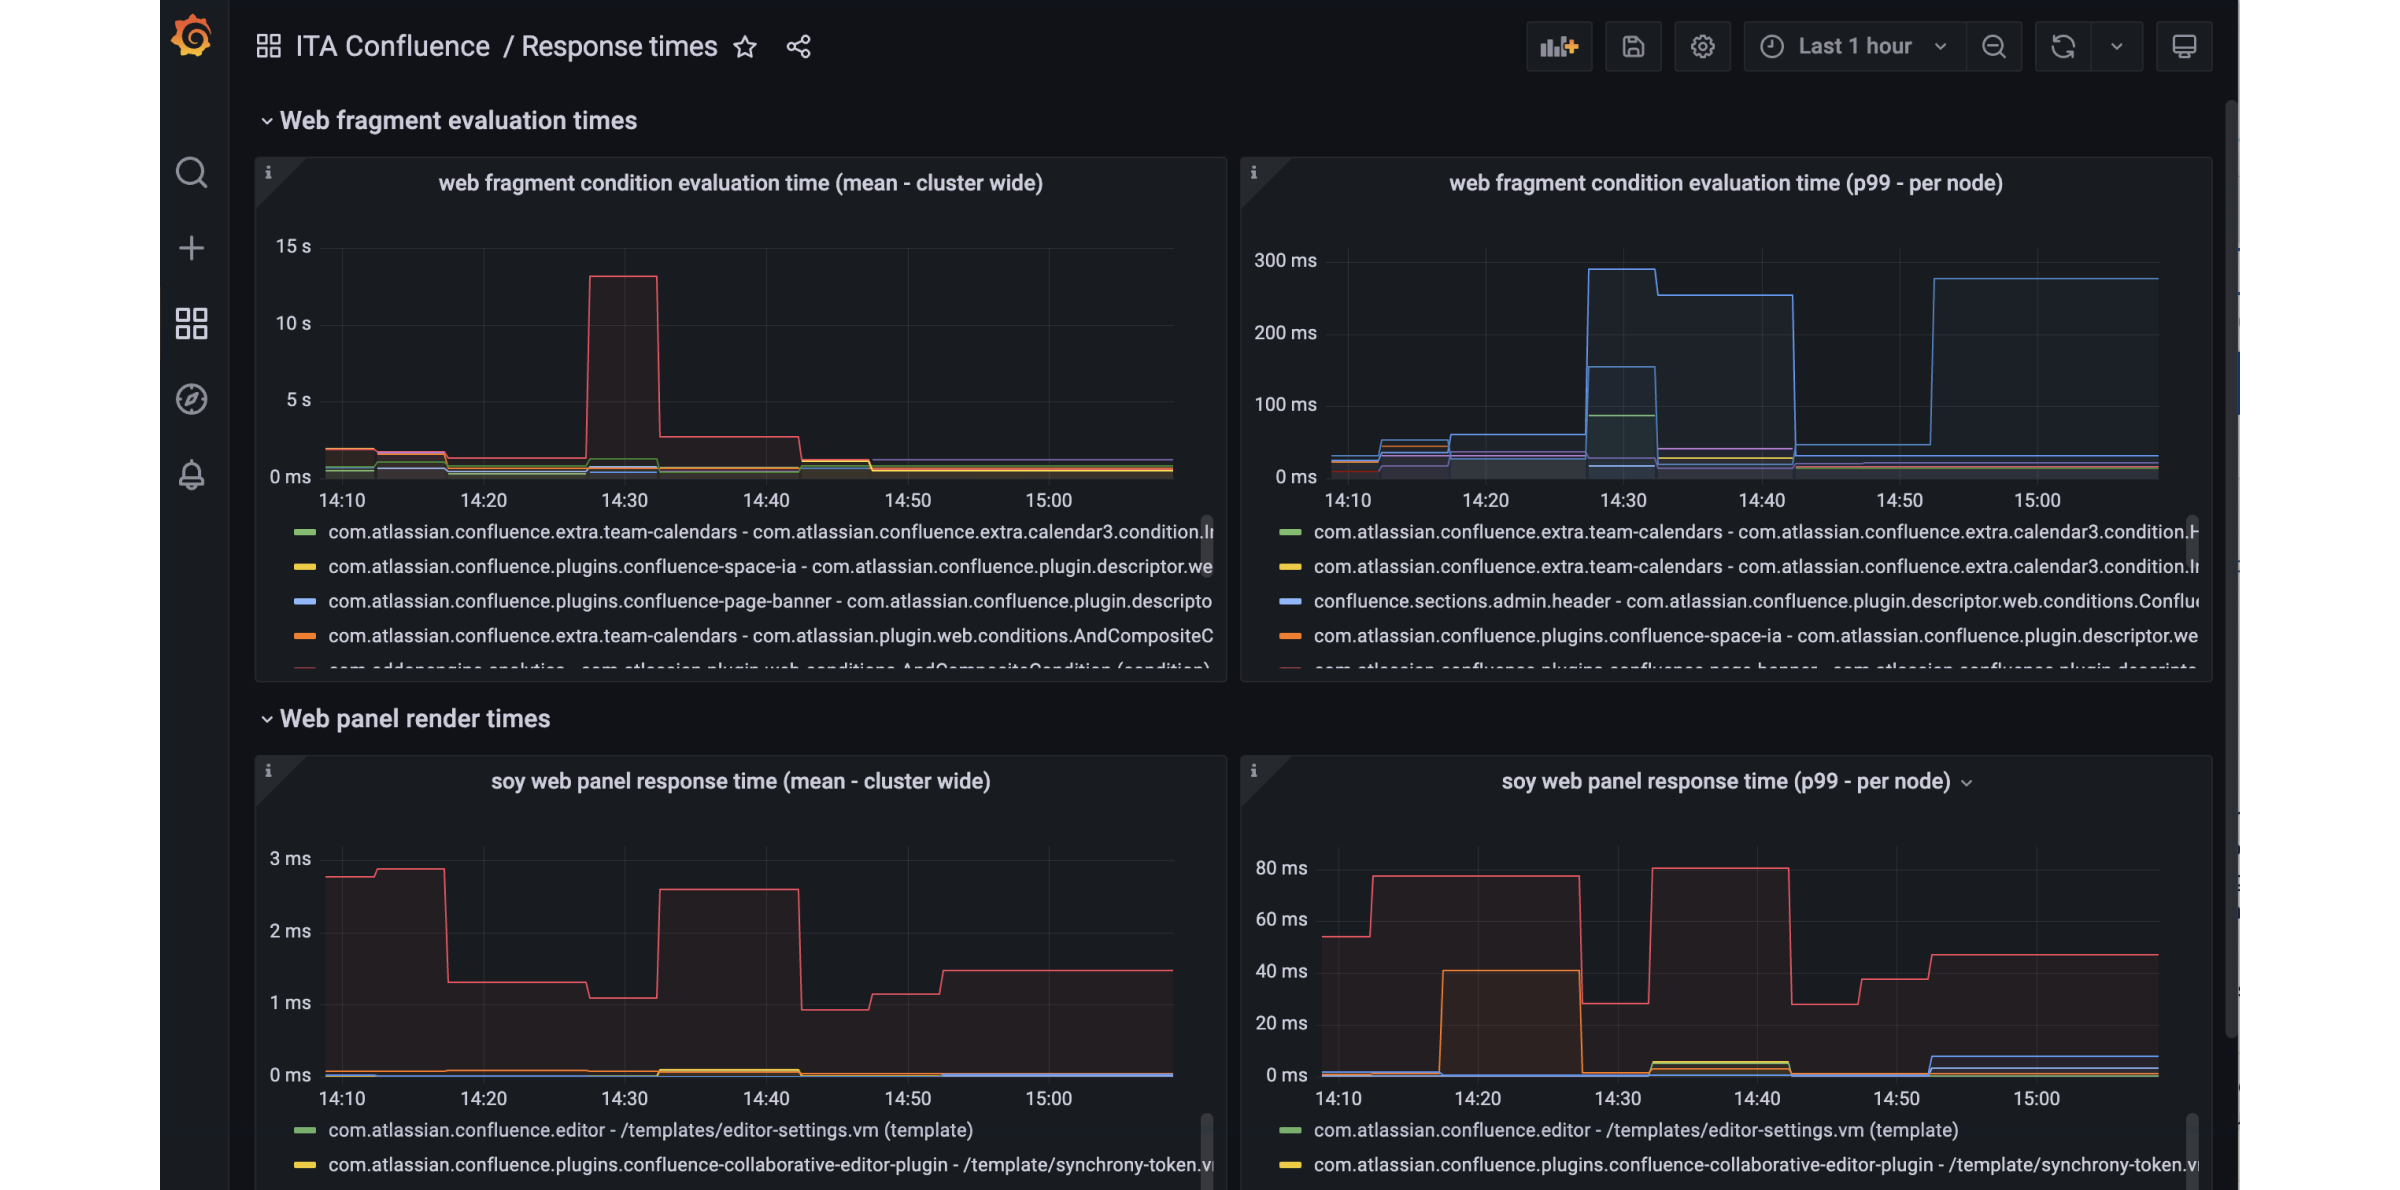
Keeping a large, busy site running smoothly requires a well-thought-out monitoring strategy. Many of you already use JMX to monitor things such as memory usage and CPU utilization. Make sure to take advantage of application monitoring to get an even more granular view of app-specific metrics. App monitoring can give you deeper insight into what apps are doing in your instance. This can be extremely beneficial to help:
-
Diagnose performance problems- It can be hard to know if a problem is due to the application, an installed app, or a misconfigured integration. App-specific metrics include the plugin key to give you a clearer picture of exactly what your apps are doing, helping you rule out or pinpoint the source of a problem faster.
-
Spot issues before they happen- Be alerted about potential problems before they happen. Examples of what you can monitor include how long it's taking to render web resources, perform AO operations, do garbage collection, and more. See the full list of app metrics and suggested alerts.
Learn more about monitoring application performance and how to install and connect Prometheus and Grafana to take advantage of pre-built templates.
3. Clean up historical data automatically
When you edit a page or file, Confluence stores the previous content so you can restore it if you need to. Over time these historical versions start to add up, increasing the size of your database and file system. It's not uncommon for some pages to have hundreds of historical versions.
Make sure you set retention rules to specify how long to keep this historical data. Tell Confluence how much historical data you want to keep (by number or age of the versions), and then a scheduled job will delete the excess, in small batches, so as not to impact your site's performance.
Maintain flexibility with the ability to define exemptions for spaces that have special requirements, then set global retention rules that apply to the rest of the content on your site. We keep everything by default, so there's no surprises.
Learn more about retention rules and how they can help optimize your instance.
4. Leverage faster permission services
There are many situations where Confluence needs to check the current user's permissions in order to determine what to display. For example, to render the Task report macro, Confluence needs to find all the pages with a task assigned to the user, then check they have permission to see the spaces and pages the task appears on. These checks can consume a lot of memory and can make some parts of Confluence load slowly, especially if your permissions are complex.
The faster permissions service changes the way permissions information is stored, allowing Confluence to check permissions on a large number of pages at scale significantly quicker. In doing so, it provides a significant performance improvement on sites with a lot of content and complex permissions.
If you only have a small amount of content or simple permissions (just a few groups, or few nested page restrictions) this service is unlikely to make your Confluence site significantly faster. Aa reminder, faster permissions service is disabled by default, but don’t worry, enabling it is simple.
Learn more about the faster permissions service
5. Changing the logging level in a cluster just got easier
Sometimes it's the small things that make a big difference to your day. On the Logging and Profiling administration page, you can now choose which cluster node you want to apply your changes to. No need to navigate to each node in your browser.
This applies to log levels, marking logs, and profiling settings.
To learn more about how to change the logging level read more here.
We hope these tips and features help you maintain and optimize your Confluence instance so your teams can continue to accomplish more together.
Was this helpful?
Thanks!
Jacob Shepard

3 comments