Community resources
Community resources
Community resources
- Community
- Q&A
- Confluence
- Questions
- Using Pie Chart Gadget with jira service desk customer satisfaction
Using Pie Chart Gadget with jira service desk customer satisfaction
Hello community,
Do you know if we can follow customer satisfaction on a dashboard using by Pie chart gadget?
I don't find customer satisfaction in the list of statistic type.

Thank you
2 answers
1 accepted

Hi Cedric,
I understand that you are looking to be able to use the CSAT data collected from Jira Service Desk within a gadget on a dashboard. Unfortunately, this information is not yet something you can retrieve via that gadget type. There is a feature request to make the CSAT data searchable via JQL over in JSDSERVER-4799. If this was implemented it could then be possible to use that gadget or others to display this information.
There is also a corresponding request for Jira Cloud platforms in JSDCLOUD-4799.
Sorry there does not appear to be a clear way to make this work today, but I would recommend watching and voting on that issue in order to see potential updates or other possible workarounds that might help here.
Andy
You must be a registered user to add a comment. If you've already registered, sign in. Otherwise, register and sign in.
You can make a filter count report based on a filter (I have done this where I have more than 1 project I want to display. Looks horrible but gets the job done.
For 1 project I created a custom report in the way shown in my screenshot. I then used a Service desk report and can show a graph and a average of the satisfaction in that project.


You must be a registered user to add a comment. If you've already registered, sign in. Otherwise, register and sign in.
You must be a registered user to add a comment. If you've already registered, sign in. Otherwise, register and sign in.
You must be a registered user to add a comment. If you've already registered, sign in. Otherwise, register and sign in.
Hi @Cedric_DEVAUX,
With the Issue Filter Formula and Advanced Issue Filter Formula gadgets offered by our Great Gadgets app, you can apply various formulas against the Satisfaction field and display the result on your Jira dashboards or Confluence pages, not as a pie chart, but in other ways.
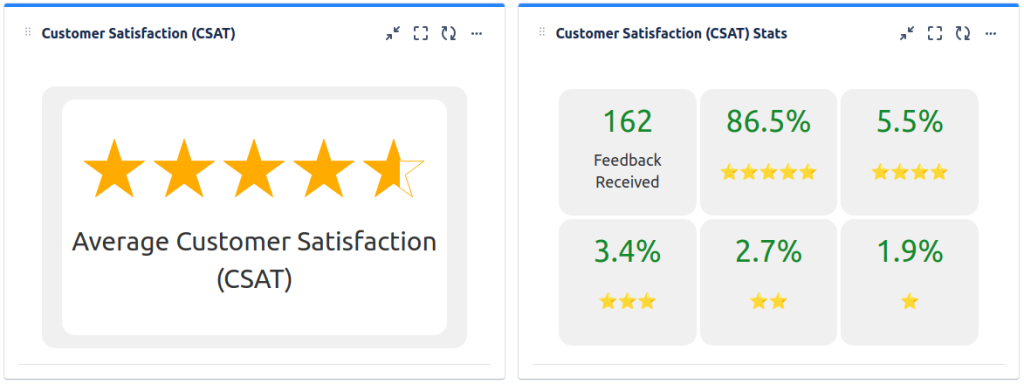
This app offers many other gadgets that you can use in Jira Service Management. See also this blog article.
I hope this helps. If you have questions, please contact us at support@stonikbyte.com.
Thank you,
Danut M.
You must be a registered user to add a comment. If you've already registered, sign in. Otherwise, register and sign in.

You must be a registered user to add a comment. If you've already registered, sign in. Otherwise, register and sign in.