Community resources
Community resources
Community resources
- Community
- Q&A
- Confluence
- Questions
- Is there a plug-in that will create a project network diagram?
Is there a plug-in that will create a project network diagram?

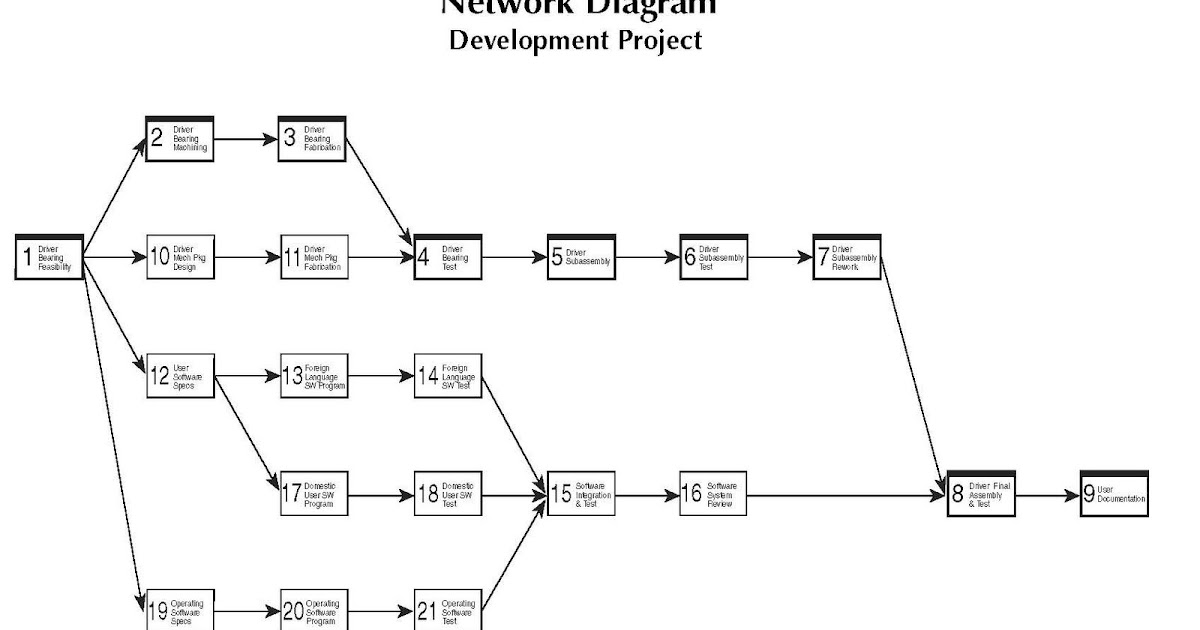
I would like to be able to create network diagrams for development projects in Jira or Confluence to show predecessors and successors, show the critical path, and calculate slack. Ideally, this would use a set of issue story cards that can be dragged and dropped in the drawing space and allow links to be created between the issues. Once created, the links would show in "issue links" section of the issue.
Is there such a tool? It would make project planning sessions much easier; I currently use sticky notes on a wall as a visual aid.
Example: 
2 answers
1 accepted

Here are some diagramming add-ons in the marketplace that I am familiar with.

Thanks Davin. Gliffy has a new product due to release in the Spring of 2018 called "Gliffy Project." It looks like that will have quite a few tools for creating project visuals.
You must be a registered user to add a comment. If you've already registered, sign in. Otherwise, register and sign in.

Looks promising, but it doesn't look like it creates the diagram based on your tickets. Rather you upload a static image and then place hotspots over the image.
You must be a registered user to add a comment. If you've already registered, sign in. Otherwise, register and sign in.

I've stumbled upon the Draw.io tool that gets me part way there...I see how to create the project diagrams I am using. Does anyone know if the shapes in the diagram can be created from issues in Jira and update Jira issues when links between them are drawn?
-Scott
You must be a registered user to add a comment. If you've already registered, sign in. Otherwise, register and sign in.

I don't think there are any diagramming add-ons in the marketplace that can do that.
You must be a registered user to add a comment. If you've already registered, sign in. Otherwise, register and sign in.

You must be a registered user to add a comment. If you've already registered, sign in. Otherwise, register and sign in.