Community resources
Community resources
Community resources
- Community
- Q&A
- Confluence
- Articles
- Creating Beautiful Tables in Confluence
Creating Beautiful Tables in Confluence
You've probably created a table or two in Confluence, right? Confluence makes it really easy for you to pack a lot of great information into your tables.
But if you're not careful, your tables can end up filling entire pages and it can become very hard for your team to find exactly what they're looking for.
We want to show you how to create tables which are:
🎯 Content focused,
👀 Easily scannable,
🔧 Functional and
✨ Beautiful!
Start learning here, check out the video 🎥
Watch how to create beautiful tables in Confluence
or read directly the full article on our Confluence Collaboration Hub.

When To Use a Confluence Table
It's easy to insert a table in Confluence and there are dozens of ways to use them to communicate important information. For example: HR teams can manage employee information like start date, title, contact data, team assignments, and more.
So, how do you decide when a table makes sense? You should use a table when readers need to find a specific piece of information about a thing, like locations, prices, age. Having this information displayed in a table makes it easier for the reader to find the section they need rather than scanning through plain text.
There are plenty more use cases for creating tables – you probably can already think of one.
Bring in Context
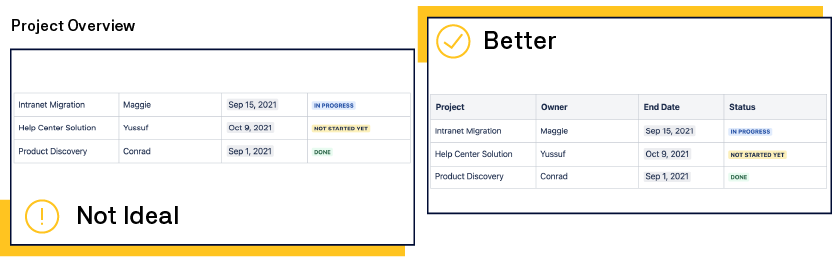
Most readers won't read big chunks of text on your Confluence pages. Instead, they'll jump directly to the table to look up the information they need.
Remember to provide the full context for your rows and columns, meaning naming them properly so your readers understand the single values in your table cells and can find information quickly and easily.
Highlight the Details
Although it's tempting to put all the data you have into your table, keep in mind that the more information you provide, the longer your reader will need to search to find the piece of information they're looking for.
The fewer columns and rows you have in your table, the better the readability is for your team. Especially if they're viewing the table on mobile!
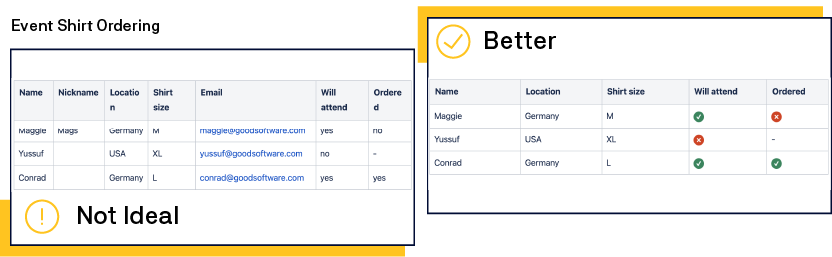
Here are some tips to keep your tables readable and clean:
Add only the essential information your readers need.
Minimize your use of text in table cells by using icons instead of text.
If it makes sense, split a large table up into smaller tables.
Scannable and Beautiful
Once you have the most important information nailed down in your tables, a sprinkling of visual formatting can improve the readability and searchability of your content.
To make your tables both beautiful and easy to scan, use simple but powerful rich content and macros like:
Simple text formatting
Bulleted lists
Emoticons
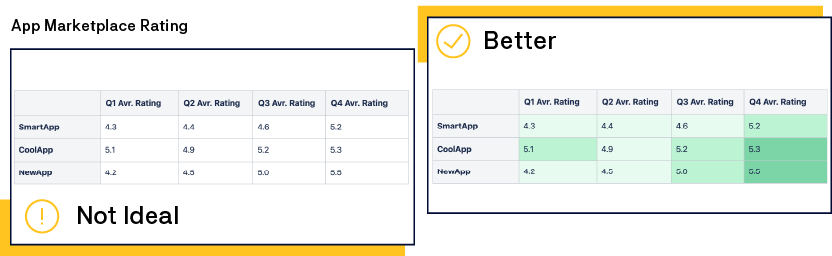
Distinguish different data sets or categories from each other using different cell colors. This helps readers focus on the information within the category they need. When colors are used correctly, you can direct attention, improve readability and comprehension, as well as promote association and recall of information.
For example, to compare numbers, make the most important number bold or create a heatmap where the highest number has the darkest color and the lowest number the lightest.
There’s an App for That!
With the default tables in Confluence Cloud, you can follow all best practices mentioned above. But there are many apps available on the Atlassian Marketplace that enable you to do even more with your tables.
On the Atlassian marketplace you'll find some apps to improve your default Confluence tables:
Advanced Tables for Confluence by Appfire. This app enhances your Confluence tables with column totals and averages, numbering, sorting, and CSS styling. It also enables filtering and adds a search field for your table. This helps your readers search for a specific entry they are looking for in your table.
Table filter and charts for Confluence by Stiltsoft allows you to filter static and dynamic Confluence tables, aggregate data in pivot table reports, transform tables and build dynamic charts, and more.
- Orderly Databases for Confluence by K15t is very useful for simple tables containing many different metadata-types. It also allows you on-the-fly editing of tables (without opening the editor) and comes in handy when you reuse or reference data a lot. You can connect data from several tables to each other and it offers a lot more features to structure your data.
Over to You...
Now, we'd like to hear from you:
How do you manage tables in Confluence?
Which best practices from this article have you already embraced?
Have we missed a best practice your team uses?
Read the full article
If you want to get out of the last bit of Confluence tables and make your tables really beautiful and fun to read. Checkout the full article about Creating Beautiful Tables in Confluence and learn more tips and tricks to keep your tables beautiful.
Or read another best practice about Confluence on our Confluence Collaboration Hub.
Was this helpful?
Thanks!
Steffen Burzlaff _K15t_
3 comments