Community resources
Community resources
Community resources
- Community
- Q&A
- Atlassian Analytics
- Articles
- Atlassian Analytics October Office Hours Recap
Atlassian Analytics October Office Hours Recap
Our monthly office hours sessions were held last week and once again we received a great set of questions and feedback from attendees. We hope these sessions enable you to learn more about Atlassian Analytics capabilities and provide examples of how you can use the product for your own business needs.
Next month’s session is on November 8 AMER / November 9 APAC and will be hosted by our Product Management team! They’ll be sharing product demos and what features are coming soon. You can find the link to sign up below or in the announcement.
👉 Register for the November Roadmap Session and Q&A
Here are some of the top questions and answers that came up in the October office hours:
Q: Are there some cheat sheets or videos available for putting together reports and dashboards?
A: Yes! We have a playlist of Atlassian Analytics product tutorials on Youtube. We also have articles published in our knowledge base with examples on a variety of topics. And if you’re looking for example charts so you don’t need to create them from scratch, there is a library of chart and dashboard templates you can use to get a quick start into analyzing your product data.
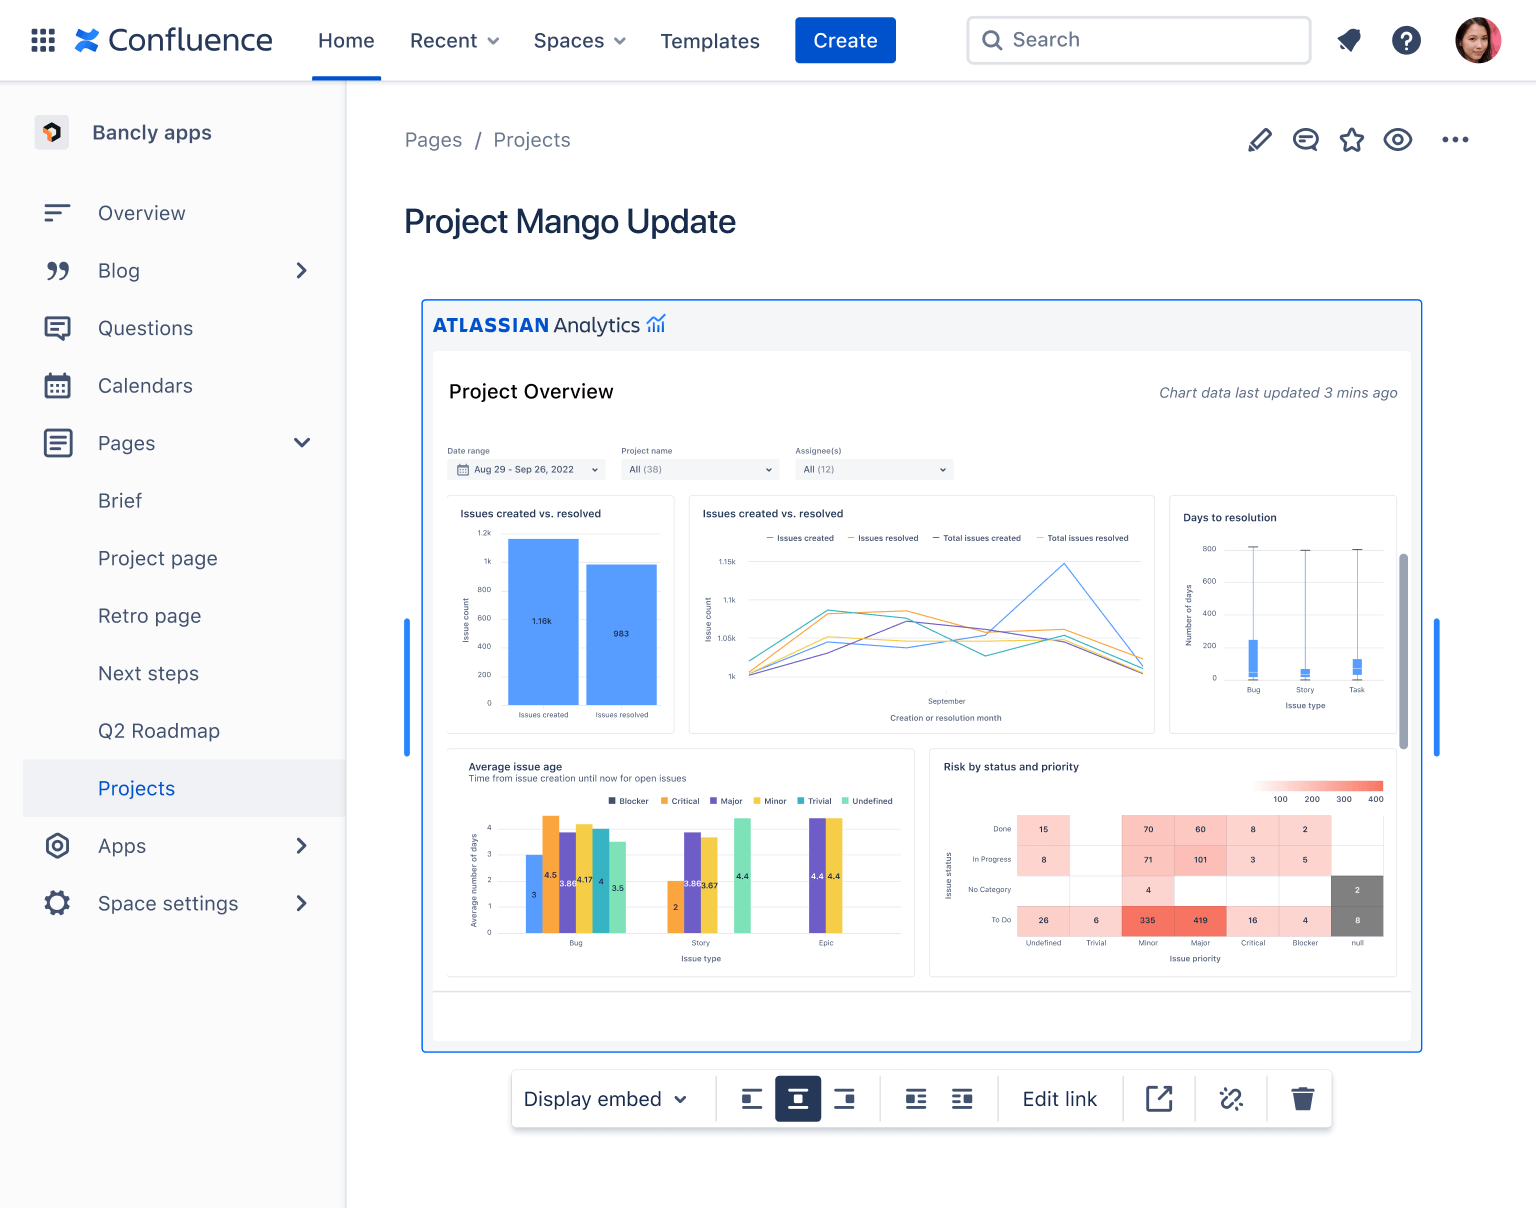
Q: Can I embed an Analytics dashboard to a Confluence page?
A: Yes, dashboards and charts can be shared using Smart Links into Confluence pages to share analysis with even more teams. The embedded dashboard will respect the permissions of the linked dashboard, meaning users who don't have access to the embedded dashboard will not be able to see its contents.
Simply paste the URL of your Analytics dashboard to a Confluence page and change the display setting to display the entire dashboard. Individual charts can also be embedded using this same method.
Q: Currently, Atlassian Data Lake connections need to be edited to include new projects created in Jira. Is there a possibility to update the connections automatically to fetch the latest data from Jira?
A: We have a feature request for project selections to automatically be included in an Atlassian Data Lake connection. Currently, this feature isn’t implemented to ensure you have full control of data security in Atlassian Analytics and the Atlassian Data Lake. If a Jira project has enhanced security permissions, those permissions are not inherited in the Atlassian Data Lake. As a result, organization admins need to decide which projects to include or exclude in a Data Lake connection to ensure users aren’t accessing data that they shouldn’t be seeing.
Q: Do you have an example of querying issue hierarchy? We’re using Advanced Roadmaps as well, so we want to visualize some of the issues in an epic or within an initiative.
A: Yes, to query the parent of a Jira issue you can use the new “Parent issue ID” column from the Jira “Issue” table. This article on how to query parent and child issues from Jira contains more detailed instructions as well as an example of how to query multiple levels of issue hierarchy.
Q: How do I query multiple custom fields at once?
A: The easiest way to query multiple custom fields at once is to use a custom table. We’ve written an article that describes how to query custom fields with custom tables that you can use. This method adds the custom fields as columns that you can directly query from visual mode.
Q: Does a custom table behave similarly to a temp table in databases? In other words, they are not physical tables available in the dashboard you’re working in?
A: Not exactly - When you create a custom table in a data source schema, rather than storing the data results, Atlassian Analytics stores the SQL and inserts it directly into your visual mode query when you query the custom table. Custom columns and tables generate nested SQL statements, and therefore, you can’t reference them by name in SQL mode queries. Sticking with the example from our office hours session, the below screenshots show an example of SQL that was used to create a custom table and the resulting SQL query that uses that custom table in the visual mode query editor:


Q: We had some data sources in Atlassian Analytics locked down for security reasons. However, we rolled it out to our organization and saw some people add themselves to query a data source. Can you explain how the permissions work?
A: To help ensure only the appropriate people have access to data from a data source, data sources are private by default. However, any users that have organization admin, site admin or product admin permissions in Atlassian Analytics do have the ability to access all data sources and dashboards in the Atlassian Analytics workspace. When an Analytics admin opens a dashboard or views a data source’s settings for the first time, they are automatically granted permission to manage that dashboard or data source. More on permissions in Atlassian Analytics can be found in our documentation.
Q: Sometimes it takes lots of time to get the latest data. Do we need to wait for refresh to complete and for how much time?
A: In September, we launched efficiency improvements to query performance for major Jira tables. As these changes are now live, you should begin to see significantly faster query performance and dashboard loading times when you query the following major Jira tables: jira_issue, jira_issue_cycle_time, jira_issue_status_history, jira_project. The data from these four tables is refreshed in a 3-hour cycle, while all other tables in the Atlassian Data Lake continue to take at least 30 minutes to refresh product data.
Thanks again to everyone who attended an office hour session! As always, please don’t hesitate to contact support for any assistance.
Was this helpful?
Thanks!
Tracy Chow

0 comments