Community resources
Community resources
Community resources
Optimizing Workflow Efficiency with Jira: Harnessing the Power of Timepiece for Trend Analysis
Jira is a versatile tool for tracking all kinds of processes, whether it's software development, project management, service management, or any other type of work. Improving these processes is not a one-time task but a cyclical one that requires continuous evaluation and refinement.
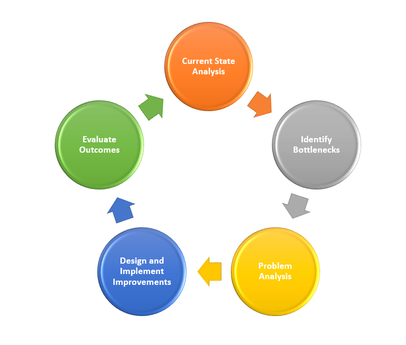
The Process Improvement Cycle
- Current State Analysis: Begin with a detailed current state analysis to capture the existing situation. At this stage, focus on observation, not interpretation. Ask: “Where are we now?” and “How did we get here?”
- Identify Bottlenecks: Detect inefficiencies by pinpointing bottlenecks within your workflow. Ask: “Where are we losing time?” and “Which steps are taking longer than expected?”
- Problem Analysis: Conduct a deeper root cause analysis to determine why these issues occur. Ask: “Which problems have the most significant effect?” and “Which ones are easiest to fix?”
- Design and Implement Improvements: Plan and execute actions to enhance efficiency. "What needs to be done to improve, and how can we achieve it?"
- Evaluate Outcomes: Assess the impact of your improvements. "Did it work? Are things getting better?"
- Repeat: The cycle is iterative, driving continuous improvement.
At two critical points in this cycle—during the initial analysis and the outcome evaluation—you need to observe trends to gauge progress. Seeing these trends is crucial for acting proactively. Don't wait for things to catch fire.
Enter Timepiece
Timepiece - Time in Status for Jira is a powerful Jira reporting app designed to provide comprehensive insights into your workflow. Here's how it can help:
- Detailed Reports: Timepiece generates reports showing the time each issue spends in various statuses, assigned to different team members, or groups.

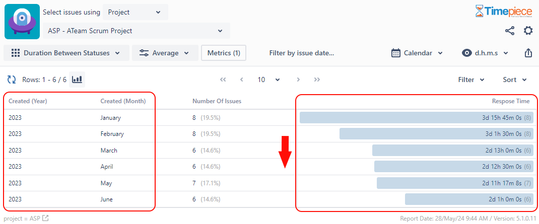
- Average Durations: Utilize the app to produce reports displaying average durations, grouped by the issue fields you select. You can see average duration fo your issues grouped by project, issue type, component, customer, vendor, service, and more.

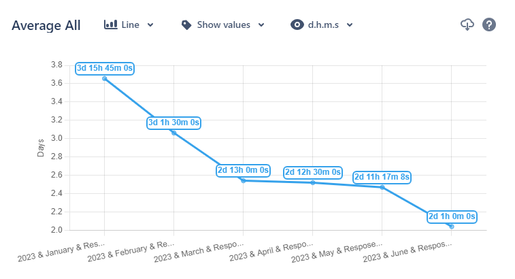
- Trend Analysis: Group issues by date fields to monitor trends over days, weeks, months, or even years. Visualize these trends with various chart types.
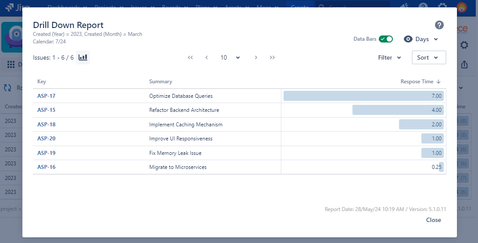
- In-depth Analysis: The Drill Down feature allows for a deeper examination of issues and durations within each group, providing detailed insights. See which issues in each group have the best or worst performance.
One of Timepiece's standout features is its ability to use existing Jira issue histories. This means you can generate reports on past issues without needing to alter your current workflows. You install the app and enjoy your first reports in a few minutes.
Seamless Trend Analysis
Ready to enhance your process improvement cycle with effortless trend analysis? Try Timepiece for free for 30 days and see the difference it can make. Don't miss the chance to unlock the full potential of your data and elevate your performance to new heights.
If you wish, you can also schedule a live demo. We will provide a comprehensive overview of the application and address any inquiries you may have.
Get started now and revolutionize your workflow with Timepiece!
Was this helpful?
Thanks!
Gizem Gökçe _OBSS_


0 comments