Community resources
Community resources
Community resources
Bring the best Business Intelligence to Confluence Cloud with Power BI
Introducing Microsoft Power BI Embed for Confluence

We are happy to announce that we have just launched Microsoft PowerBI Embed for Confluence, an integration that makes it much easier to share reports and data with your entire company.
When you embed Power BI in Confluence Cloud, you bridge the gap between data and decision making.
About PowerBI

Power BI is a leading Business Intelligence tool by Microsoft providing interactive data visualizations that are easy for users to create. The main competitors of Power BI are Tableau, Qlik Sense, Google Data Studio or Looker.
Why use PowerBI
Stunning data visualizations
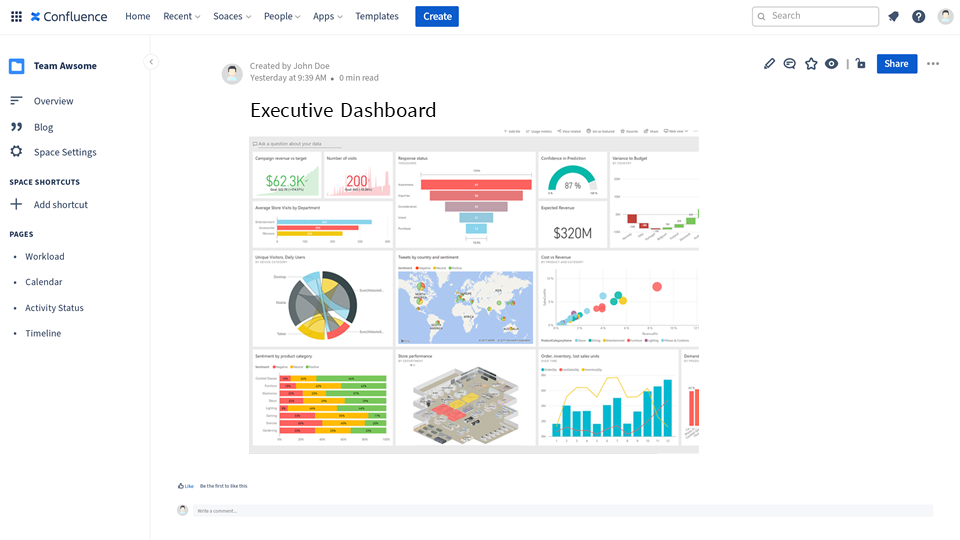
For years, excel reports were a synonym of poor graphic output. Forget about that legacy. In Power BI, the visual quality is second to none.
Connect to any Data Sources
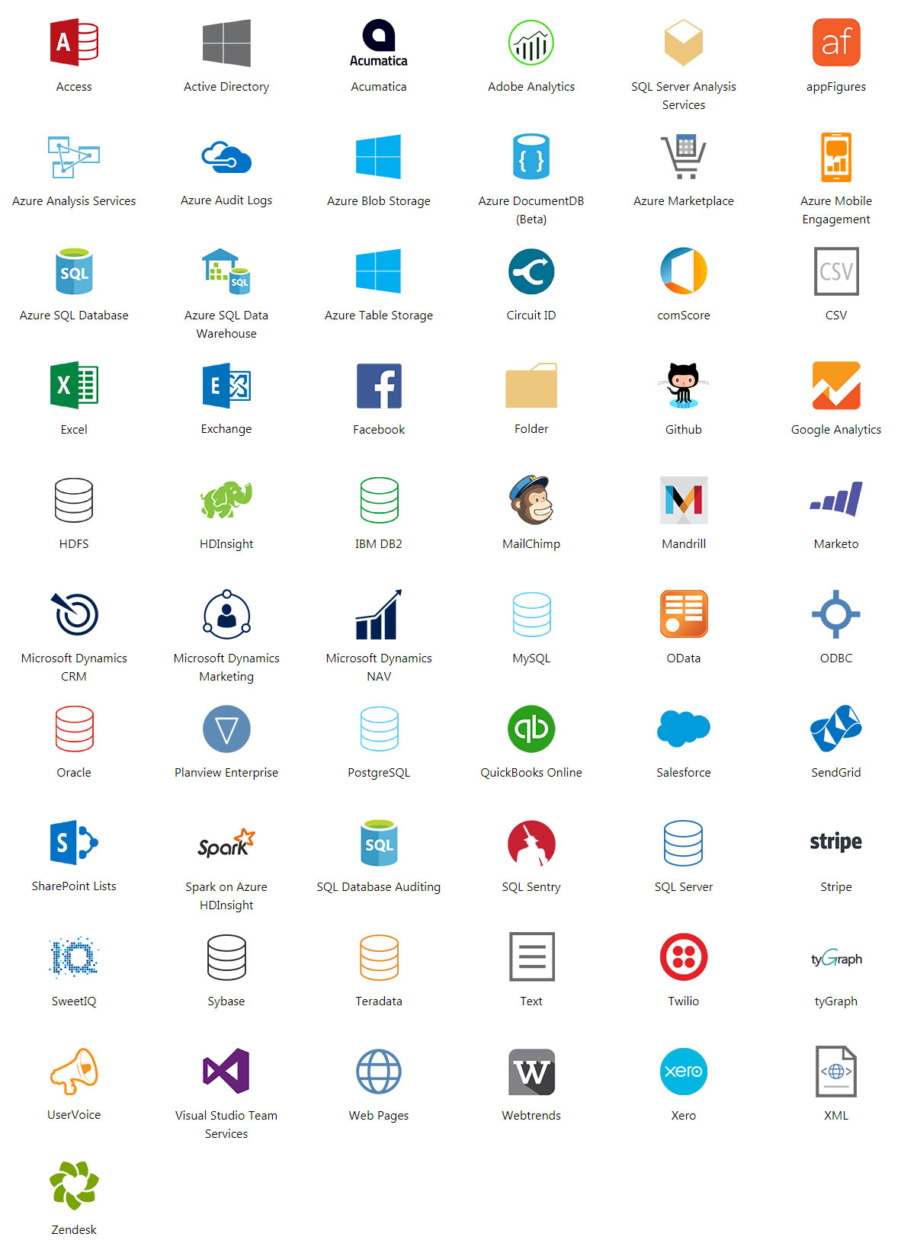
It doesn’t matter where your data lives. Power BI connects to a huge list of data sources that you can draw on with DirectQuery.
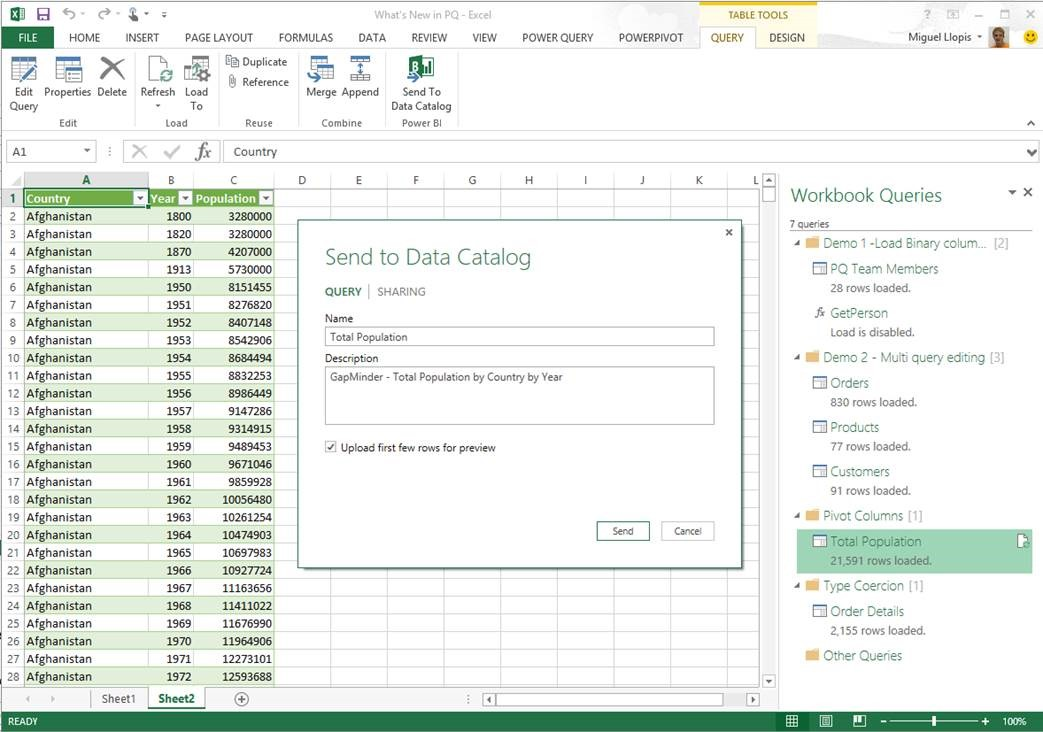
Operates seamlessly with Excel
Use excel queries and your latest models to publish dasboards and reports in PowerBI. And forget about version control.
Learn more about how excel connects with PowerBI here.
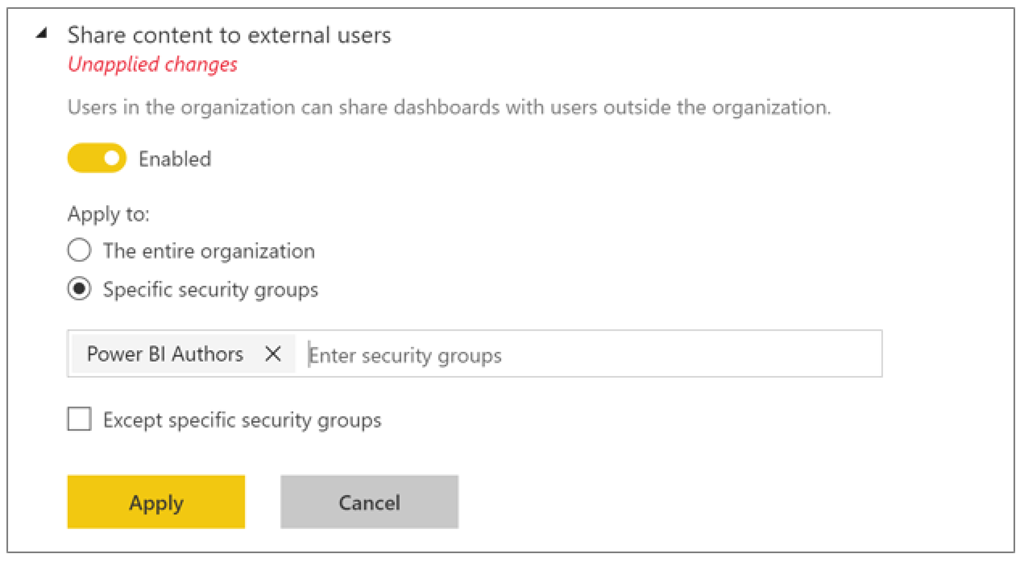
Secure Data
Data security in Power BI is about much more than securing access to your reports. Classify and label sensitive data, monitor and protect user activity, and set up policies for exported data.
Go fancy. Leverage AI
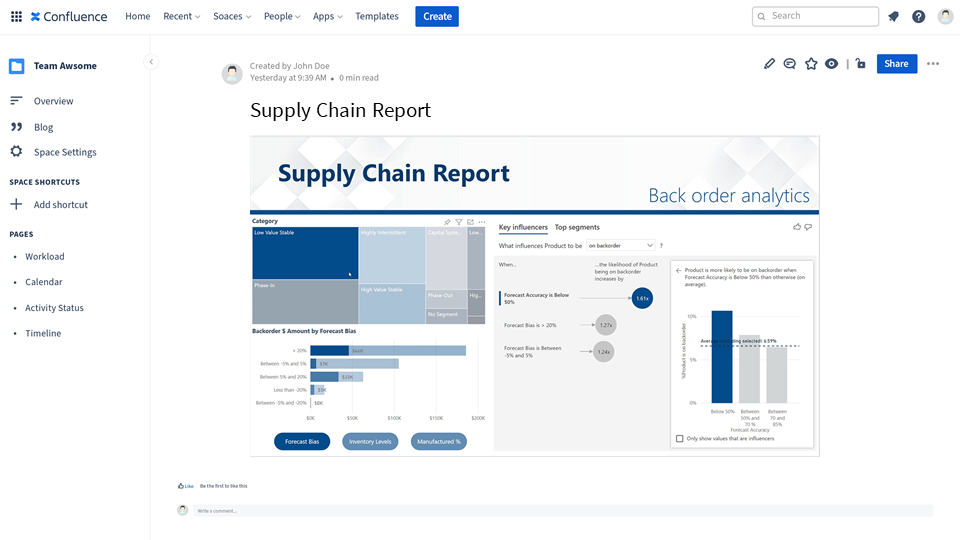
Historic data is interesting for a reason: you can create machine learning models to create predictions for you.
Advantages of integrating Power BI into Confluence
Real time reporting with always current data
You have dozen of static reports in Confluence. Unfortunately, they are born out of date. The nature of Power BI is to show always current information so you can monitor trends as they unfold.
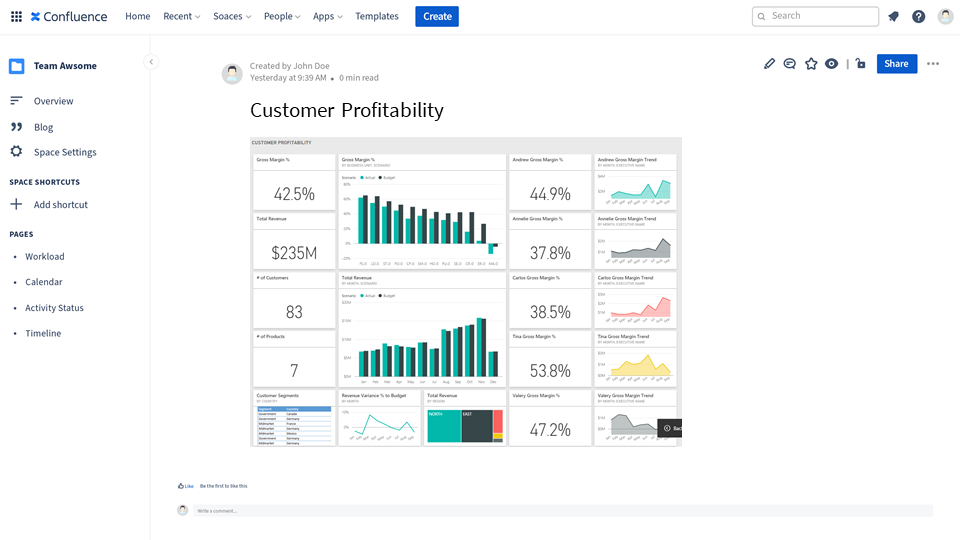
Tell a persuasive, memorable story
Visual information is easier to remember. And your readers are more likely to believe the story you’re telling if you’re backing it up with real data.
Let’s make the mental experiment. Which of the following situations would you remember better at a meeting?
Scenario 1:
The VP of Engineering uncorks a bottle of champaign as he applauds: we have more business and are completing more work than ever at the company. And the increase this year has been magnificent! That’s what all the managers keep saying!
Scenario 2:
The VP of Engineering uncorks a bottle of champaign and makes the same announcement as he shows the following calendar in the screen:
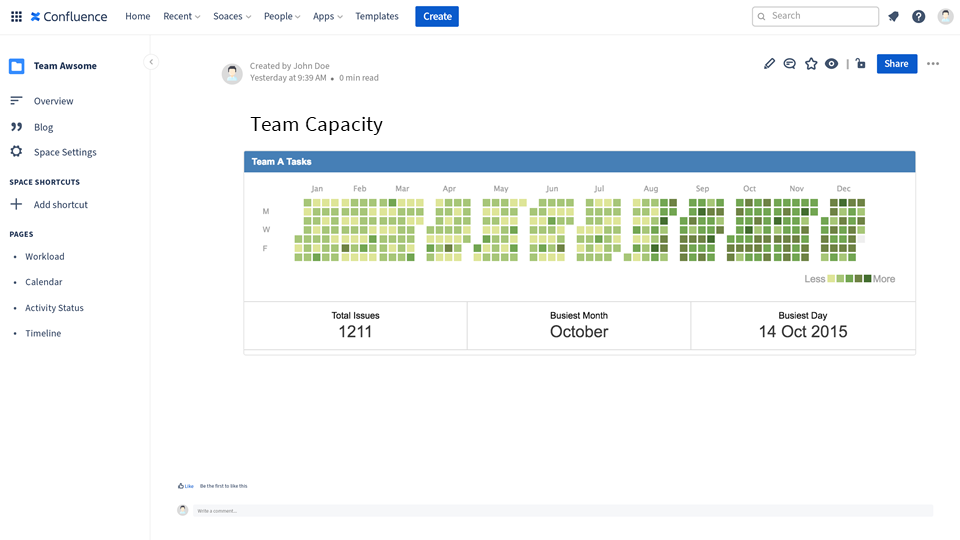
Then she concludes: “We’ve had a feeling of the velocity that we were catching, but we’ve been able to confirm that this is a maintained trend across teams”.
Every Confluence user on the same page
Monitor company KPIs and OKRs to align teams and stakeholders on a shared vision!
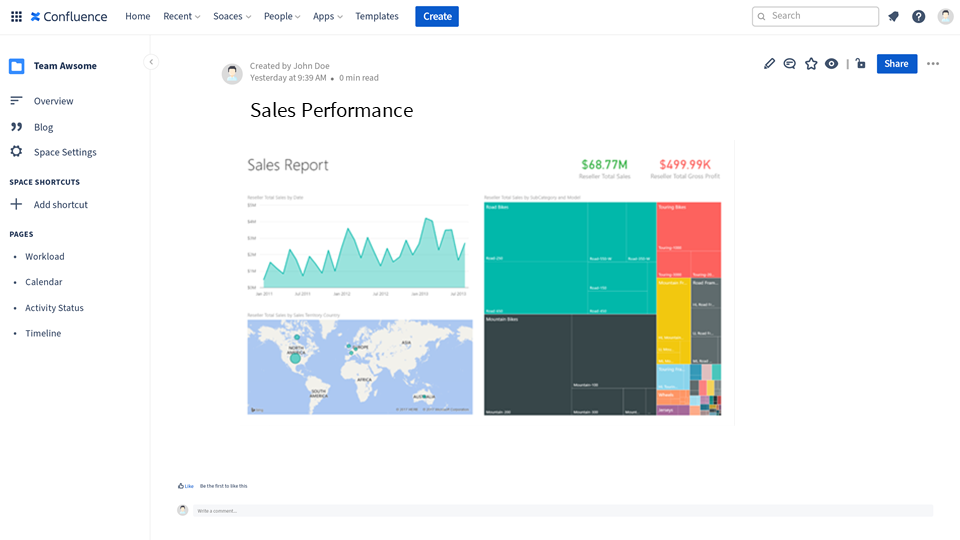
How to integrate Power BI with Confluence
To start using Microsoft Power BI for Confluence, you simply need to:
- Follow the instructions in the Getting Started page. They vary depending on whether you want to share a form or a report.
- Paste it into your Confluence page. But you can also use the /powerbi command or find the app in the macro menu, if that’s easy for you.
- Hit publish, and enjoy!
Would you like to do more?
Integration with other sources of data? Interactive reports and data filtering, directly from Confluence? These are just random ideas, but we’d like to know what you think.
If you would like to do more with PowerBI directly from Confluence, let us know your thoughts! We’re actively collecting customer feedback to develop this integration further and make Confluence much more than a knowledge management platform.
Was this helpful?
Thanks!
Jaime Capitel
1 comment