Community resources
Community resources
Community resources
How to use the Calendar report in Report Builder
Our Report Builder app is a unique tool that allows you to create custom Jira reports. The report module consists out of three tabs. In the “My reports” tab, you will find all your created reports. Here you can edit or delete them. In the “Shared” tab, you will find every shared report for your current user. Finally, in the “Create report” tab, you will find the report gallery.

In the gallery, we differentiate between Quick reports and Scripted reports. Quick reports are ready-to-use report templates in Report Builder’s gallery. By simply opening and adjusting the data or filters, you will get data insights instantly. Unlike Scripted reports, you can not modify the layout and code of these reports. However, they enable immediate results for the most important key figures in your team, such as your teams’ workload.
A quick report that is very popular is the Calendar report.
The Calendar report’s main aim is to display issues in a calendar view. Thus, giving you a better overview of the processing time for different tasks from different sources and showing vacation time within your team. You can choose between three different views: Monthly view, weekly view, and Weekly view with time.
A practical guide: How to create our Calendar report
-
Create a new source by clicking the “Add Source” button in the upper right corner.
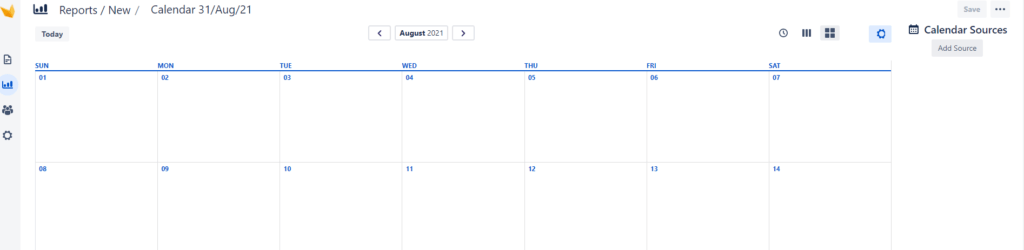
A pop-up window appears which you have to configure
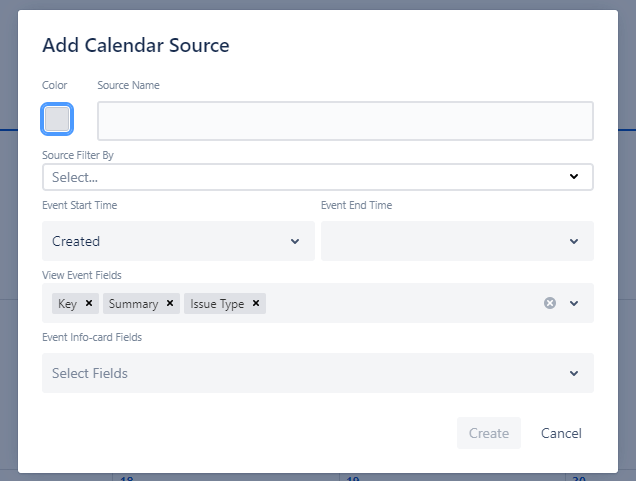
2. In this pop-up window, “Add Calendar Source” you need to set:
-
-
-
Color: Pick any color for your event
-
Source name: Pick an event name
-
Filter By: You need to select which projects, issues, etc. you want to see in the calendar
-
Event Start Time: Select an action at which your event should start
-
Event End Time: Select an action with which your event should end
-
View Event Fields: These fields will be shown in the body of the event card
-
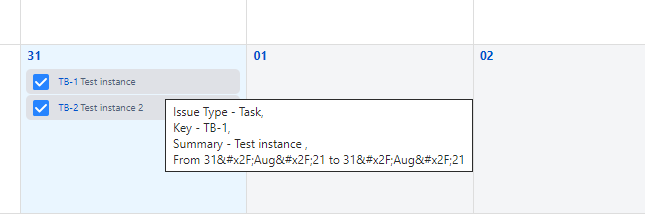
Event Info-card Fields: These fields will be shown in the pop-up after clicking on the event card
-
-
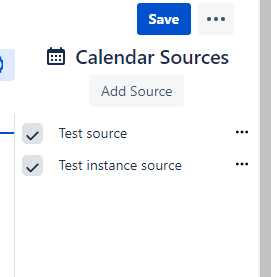
On the right side of your screen, you can filter your previously created calendar sources. Here you have the option of showing or hiding the sources in your view using the checkbox in front of them.
The report is particularly suitable for displaying the range between the start and end time of solving issues. You get a practical and quick overview of which issues were processed, when and for how long. You can also get a clear display of when your employees have weekends and when they are on vacation. Your employees only need to create tickets for their vacation or free time, and then you can filter your event accordingly and create a vacation source.
Interested? Learn more about our Report Builder in our short product video: Reporting in Jira – Working with Report Builders section “Reports” | Actonic – YouTube
Would you like to learn more about our reports? Check out our Report Builder series.
Was this helpful?
Thanks!
Andreas Springer _Actonic_
0 comments