Community resources
Community resources
Community resources
📖 How to Configure and Manage SLA Severity in Jira?
Last time, we explored SLA Complexity, how to configure it, and why it's essential. Today, we'll explore another equally valuable field: Severity. We'll examine its role, how to set it up, and why it's critical to effective SLA management.
Severity is key in determining the urgency of tasks or issues based on their impact on business operations. While Complexity focuses on the effort required to resolve a task, Severity emphasizes the consequences of not addressing an issue promptly.
In this article, we'll explore Severity, its differences from other metrics, and how to implement SLAs by Severity for optimized workflows. Let's get started!
What is "Severity"?
Severity measures an issue or task's impact on a system, product, or business process. It indicates how critical the issue is and helps teams prioritize resolutions based on the potential consequences of delays.
Severity is a widely used metric in IT operations, software development, and customer support to assess the urgency of addressing incidents or tasks. Unlike other metrics, such as priority or Complexity, Severity focuses specifically on an issue's business impact.
For example, a high-severity problem might disrupt critical workflows or affect many users, while a low-severity issue might be less urgent and cause minimal inconvenience.
How to determine the right Severity Level?
Determining the correct severity level for a task or issue is essential for effective SLA management. It ensures that resources are allocated appropriately and critical issues are addressed with the urgency they demand.
Here's an example table based on common severity levels and response time:
|
Severity Level |
Description |
Response Time |
Resolution Time |
|
S1 - Critical |
Severe issues cause system outages or data loss and impact all users or core functionalities. |
Immediate (within 15 min) |
4 hours |
|
S2 - High |
Major issue disrupting significant functionality for many users; urgent but less severe than critical. |
1 hour |
8 hours |
|
S3 - Medium |
Moderate issue with noticeable impact but no critical disruption; affects some users or features. |
4 hours |
24 hours |
|
S4 - Low |
Minor issue with minimal impact on usability or aesthetics; affects a small number of users. |
8 hours |
48 hours |
S1 - Critical Severity 🔴
These are the most urgent issues that require immediate attention. They severely disrupt business operations, impact all users, or result in data loss.
Examples:
-
System-wide outage affecting all users.
-
Security breach exposing sensitive customer data.
-
Corrupted database resulting in data loss or inaccessibility.
🚀Action: Teams must respond within 15 minutes and resolve the issue quickly (typically within 4 hours).
S2 - High Severity 🟠
These are significant issues that disrupt major functionalities for many users. While not as severe as critical issues, they still require prompt action.
Examples:
-
Payment gateway not processing transactions.
-
API failure affecting integrations with key business systems.
-
Application crashes under specific user conditions.
🎯Action: Teams should respond within 1 hour and aim to resolve the issue within 8 hours.
S3 - Medium Severity 🟡
These issues moderately impact functionality, affecting some users or features without completely halting operations.
Examples:
-
Feature inconsistencies, such as filters not working in reports.
-
Slower-than-usual application performance during peak hours.
-
Errors affecting a specific group of users or devices.
⭐️Action: Teams should respond within 4 hours and resolve the issue within 24 hours.
S4 - Low Severity 🟢
Minor issues with limited impact, typically aesthetic or usability-related, affect many users.
Examples:
-
UI glitches, such as buttons misaligned or wrong colors.
-
Typos in text or tooltips.
-
Styling inconsistencies that do not affect functionality.
🔥Action: Teams should respond within 8 hours and aim to resolve the issue within 48 hours.
💡 Important note
Each severity level has a specific initial response time commitment (or "SLA"). Selecting a particular severity level ensures you'll receive an initial response within the specified timeframe.
It's important to note that "initial response" means Support will review your ticket and reply within the defined time, but it doesn't guarantee that the issue will be resolved.
What happens if I choose the wrong Severity Level?
Choosing the wrong severity level isn't something to stress over—it's there to help categorize and prioritize issues. Do your best to select the level that matches the situation based on the provided definitions.
It can always be adjusted if the chosen severity level doesn't accurately reflect the issue's impact. For instance, if a ticket's impact turns out to be higher or lower than initially thought, the support team can update its severity level accordingly and notify you about the change.
And don't worry—assigning a lower severity level doesn't mean you'll be left waiting indefinitely. Regardless of Severity, every ticket will receive a timely response within its respective SLA timeframe.
How to set up severity levels in Jira?
You'll need to follow a few simple steps to set up severity levels. First and foremost, you'll need to:
№1. Create a custom field for Severity
-
Go to Settings → Issues → Custom Fields.
-
Click "Create Custom Field" and choose a type, such as Select List (Single choice) or Dropdown (Select List).
-
Name the field "Severity" and add options for the levels you want to track (e.g., S1 (Critical), S2 (High), S3 (Medium), S4 (Low))
-
Link this field to the appropriate screen schemes (screens).
Once this is set up, you can manually assign a severity level to each issue during its creation or later in the workflow.
№2. Set up workflows or automation
Jira allows you to use automation to streamline severity management:
-
Define automation rules that adjust Severity based on specific conditions.
-
Use custom workflows that require severity selection during issue creation to ensure that every task is categorized.
While this manual setup in Jira is helpful, it may become complex as your team grows or the number of issues increases.
The next step is to use the SLA Time and Report for Jira app. This add-on takes severity tracking to the next level by simplifying setup and providing enhanced monitoring and analytics capabilities.
№3. Configure Severity levels in SLA Time and Report
-
Open the SLA Time and Report app. Navigate to the app from your Jira dashboard.
-
Create a new SLA configuration: in the SLA Configuration section, start by creating a new SLA condition specifically for severity tracking.
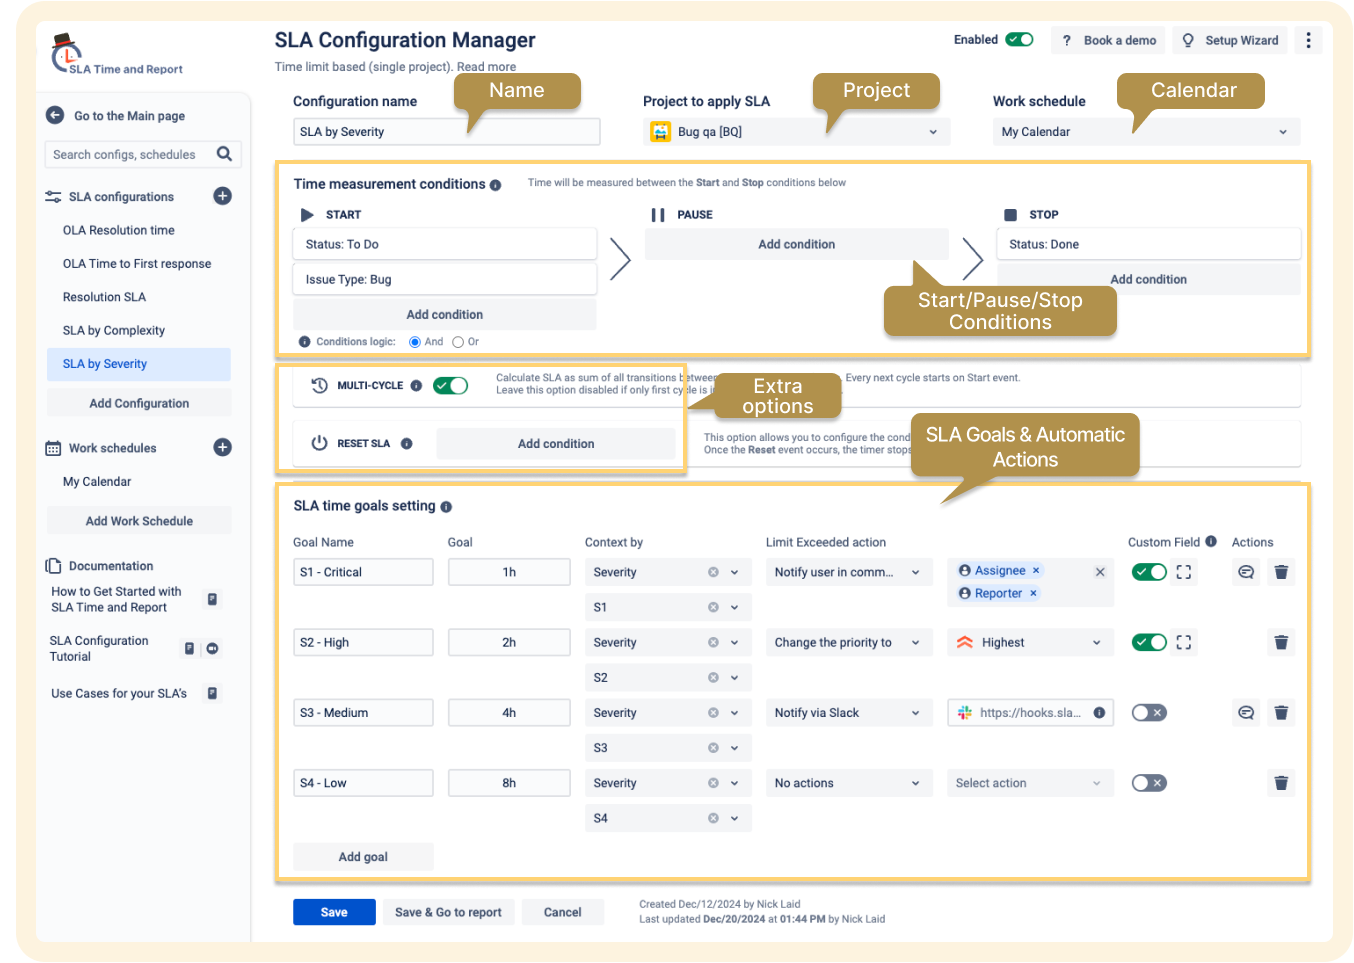
4. Configure additional parameters: adjust the SLA settings to align with your workflow. This includes linking it to relevant projects, teams, or issue types.
5. Set Start/Stop/Pause conditions. Define the conditions under which the SLA timer will start, pause, or stop. You can configure this using standard or custom issue fields, such as issue statuses, assignees, or severity levels.
6. Add SLA Goals for Severity levels. Define the resolution times for each severity level. For example:
-
S1 - Critical: Time to resolve = 1 hour.
-
S2 - High: Time to resolve = 2 hours.
-
S3 - Medium: Time to resolve = 4 hours.
-
S4 - Low: Time to resolve = 8 hours
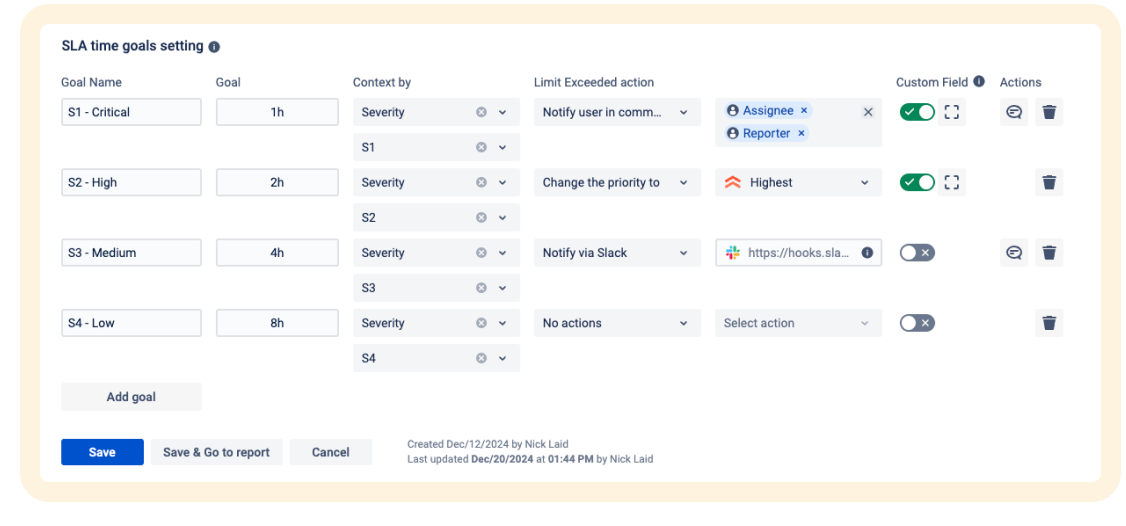
8. Once all settings are complete, save your SLA configuration and activate it
🎉 That's all for setting up! Let's move on to reporting.
How to track Severity-Based SLA performance?
With the setup complete, the next step is tracking and analyzing your severity-based SLA performance effectively. Using the SLA Time and Report for Jira app, you can access powerful reporting tools to monitor progress, evaluate efficiency, and ensure critical issues are resolved within SLA targets. Let's explore how!
№1. Navigate to the Reports section
-
Open the SLA Time and Report app from your Jira dashboard.
-
Go to the Reports tab in the app menu to access the reporting functionality.
-
Apply filters to focus on specific data:
- Select Severity as the key parameter to analyze SLA performance for different severity levels (Critical, High, Medium, Low).
- Add filters like Project, Team, Assignee, or Time Period to refine your view.
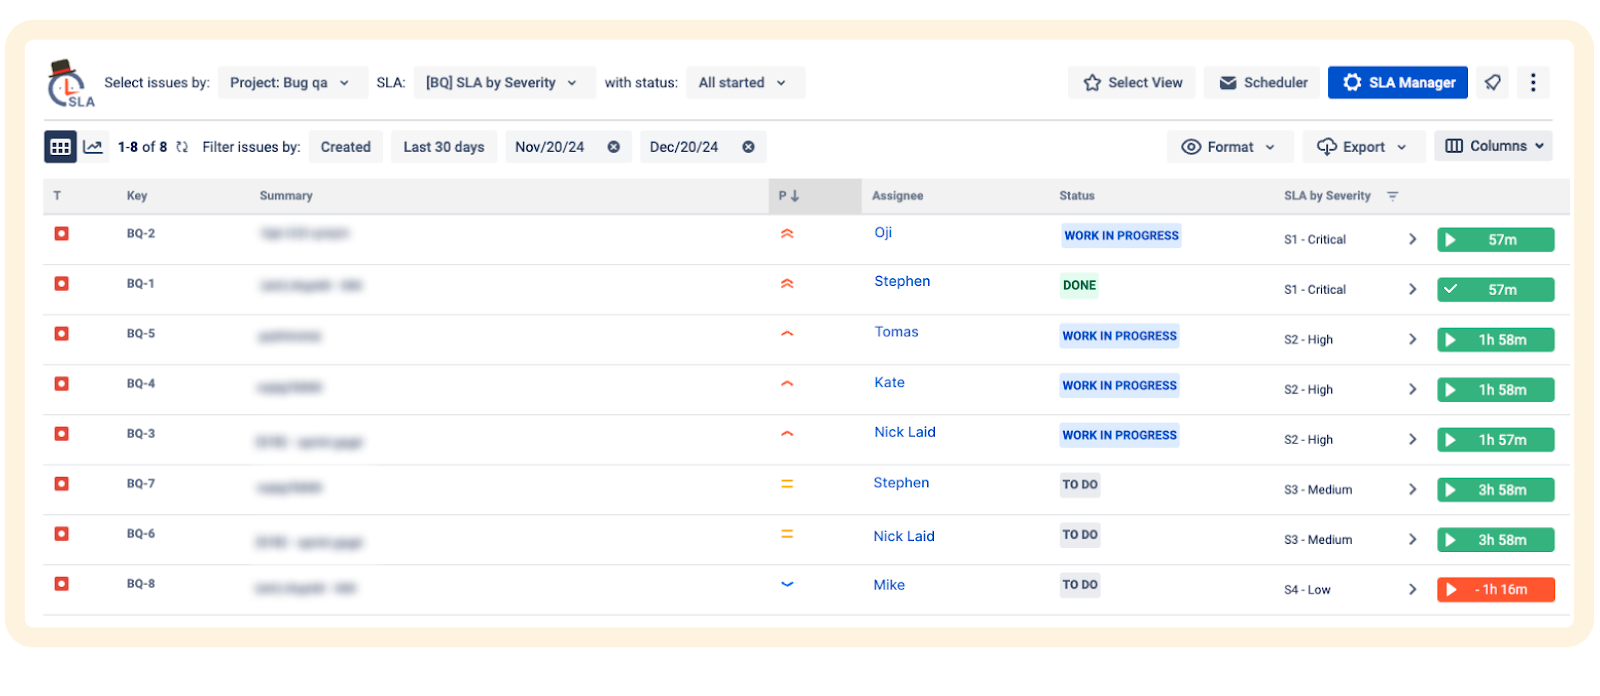
4. Use these insights to optimize your SLA and workflows:
You can monitor the remaining time on this panel until the SLA goal is reached. Tickets that exceed their SLA targets are highlighted in red, while those still within the time limit or successfully resolved are marked in green:
№2. Explore Graphical Views
Switch to graphical views to visualize performance 📈:
-
SLA Met vs Exceeded: This bar chart shows the ratio of SLAs met versus those exceeded over a specific time period. It helps teams identify trends and measure progress in meeting SLA targets across different timeframes.
-
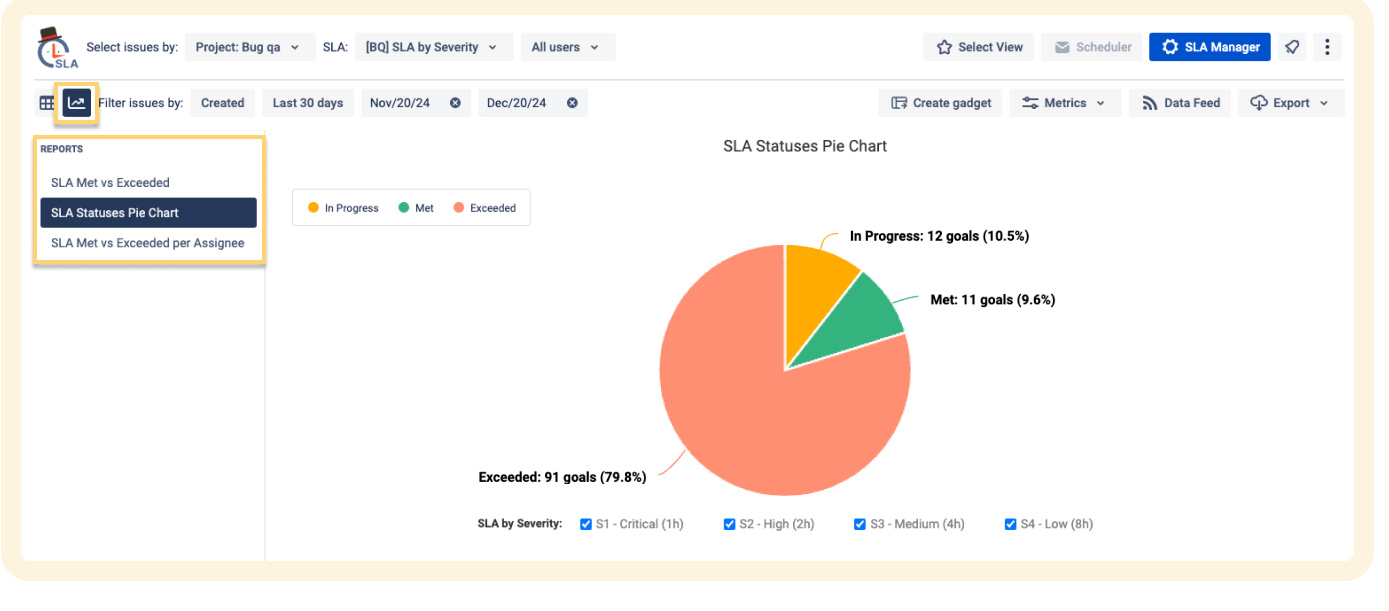
Pie Chart: This chart provides a quick overview of SLA statuses. It visually displays the percentage of tasks that are in progress, have met their SLA goals, or have exceeded their limits.
-
Graph per Assignee: a detailed breakdown showing how individual team members perform against SLA goals.
№3. Analyze key metrics
Check essential SLA metrics:
-
Resolution Time: Average time taken to resolve issues for each severity level.
-
Response Time: Evaluate if the team meets initial response targets for Critical or High severity tasks.
-
Breach Rates: Identify which severity levels have the highest breached SLAs.
№4. Generate Detailed Reports
Export data into detailed reports for further analysis or sharing with stakeholders:
-
Severity-level breakdowns with compliance percentages.
-
Summary reports for specific projects or teams based on Severity.
№5. Identify Trends and Take Action
Use the insights to:
-
Adjust SLA goals for severity levels if certain thresholds are frequently breached.
-
Redistribute resources to focus more on Critical and High-severity issues.
-
Provide feedback to teams or adjust workflows to optimize performance.
By following these steps, you'll understand how your team performs against severity-based SLAs and can make data-driven decisions to enhance productivity and service quality.
Implementing and tracking severity-based SLAs ensures your team addresses the most critical issues with the urgency they deserve while maintaining overall efficiency. With SLA Time and Report for Jira, you gain the tools to configure severity levels easily and monitor, analyze, and optimize your performance through intuitive reports. Start leveraging these insights today to improve workflow transparency, meet SLA targets, and deliver exceptional results.
Was this helpful?
Thanks!
Alina Kurinna _SaaSJet_
0 comments