I am able to see the EPIC burndown chart on reports page, however I need it to be on the Dashboard and configurable for each EPIC as one graph,
Hi @Sandhya N
You can add your Sprint burndown chart instead when you are choosing your gadgets from the dashboard.
There is no ootb Epic burndown chart gadget.
There is only the report on the space.
You would need to see the Atlassian marketplace for options
Thank you for the suggestion, appreciate it.
I have explored that and this chart does not help my purpose of reporting.
Thank you for the response. I shall look into marketplace.
Hi, @Sandhya N
Unfortunately, Jira's native Epic Burndown report isn't available as a dashboard gadget, which limits your ability to create that configurable dashboard view you're looking for. The built-in dashboard gadgets typically focus on sprint-level burndowns rather than Epic-specific ones.One way to work around this is to use Report Hub Custom Charts, Reports & Timesheets for Jira, an app my company built that lets you create customized reporting dashboards. You can configure multiple Epic burndown charts within a single Hub, with each chart tracking a different Epic, and these Hubs can be shared across your team or embedded for easy access. If you prefer to stay with native Jira functionality, you might also consider using the Sprint Burndown gadget on a dashboard if your Epics align with specific sprints, though this won't give you the Epic-specific view you mentioned.
In that case, you need to look for the Atlassian marketplace or to create your own custom Forge application.
Hi @Sandhya N,
Welcome to the Atlassian Community!
Jira does not provide an Epic Burndown chart gadget out of the box. You can, however, try using the Epic Burndown report available in the Reports section of your project.
If you want to display an epic burndown on your dashboard, a solution would be to search for a plugin (app) on the Atlassian Marketplace.
If you’re open to using a plugin, our Great Gadgets app offers a Release Burndown Burnup Chart gadget that can also display an epic burndown - all you have to do is to configure it with a filter/JQL that returns the issues from your epic. It supports also subtasks, works with any type of estimates and can make ETA forecast.
More details and steps on how to do this in these articles:
Hope this helps. if you need any help in configuring our gadgets feel free to contact us at support@stonikbyte.com.
Danut
Welcome to Community
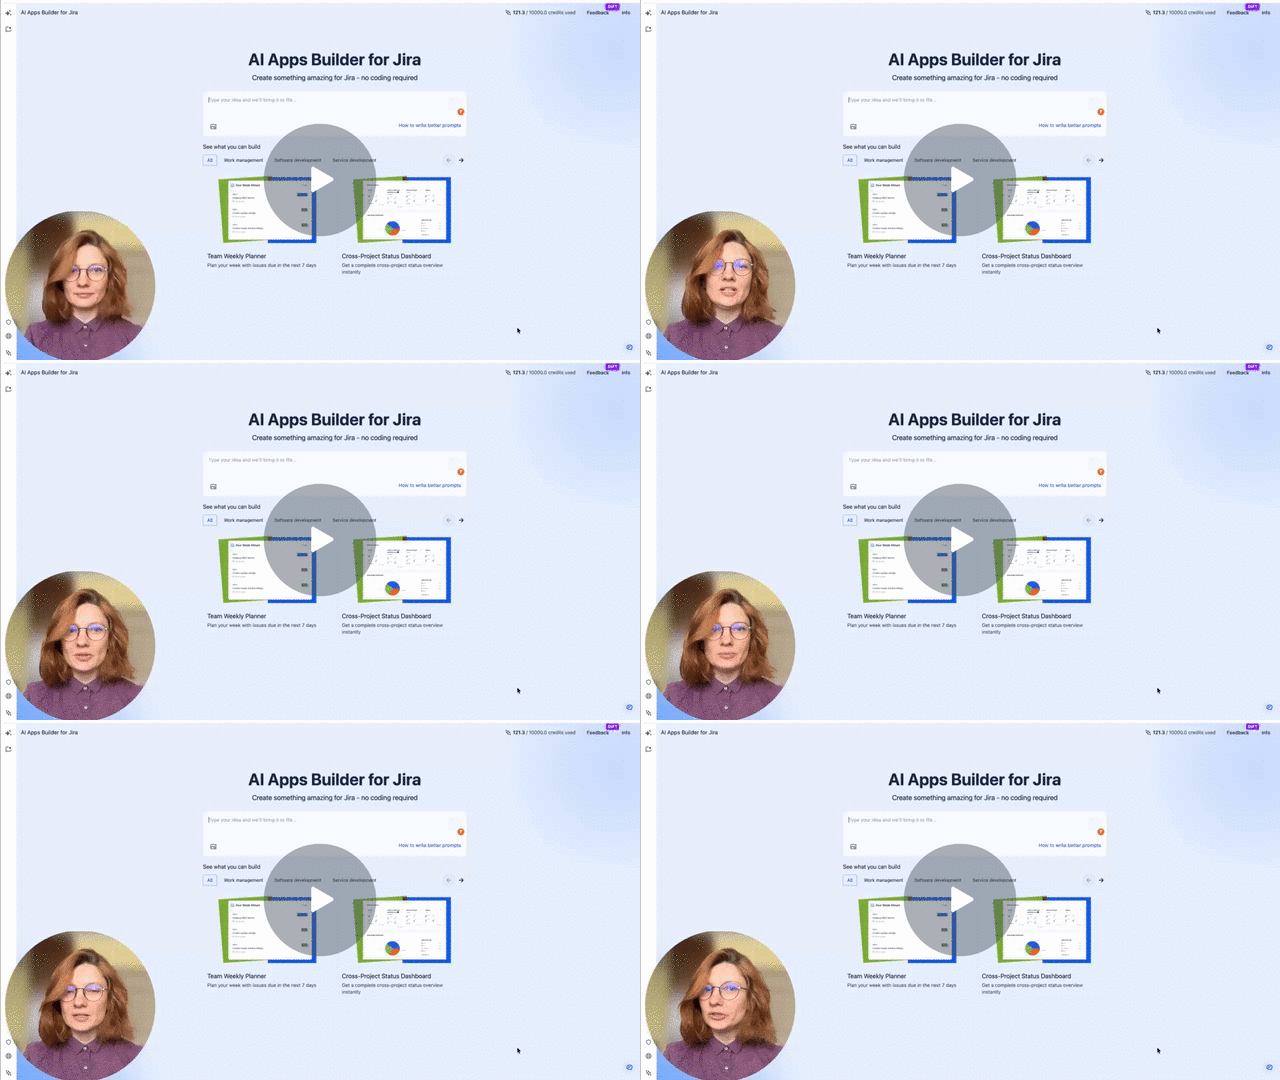
As @Nikola Perisic already mentioned, you can build your own custom Forge app to solve your request. Now it is really easier with vibecoding tools. And I'd love to recommend you try AI Apps Builder. This is a no-code tool that my team developed. AI Builder lets you create custom Forge apps from plain-language prompts. You describe the dashboard you want to create, and it produces a working, installable Jira Cloud dashboard.
You can watch my recent video to see how AI Apps Builder works:
Build a Jira Subtask Generator Fast with AI Apps Builder🚀 - Watch Video
I hope the AI Apps Builder helps you solve your request.
Thank you for all the answers. As no straight forward solution, I used Excel ;-)
I will not be monitoring the answers anymore.
As others pointed out, Jira native solutions are limited to the Epic report that you mentioned isn't what you're looking for.
If you're open for 3rd party solutions, the ones shared above are good solutions as well. So just wanted to offer another option that might be lightweight but also support dynamically seeing the burn down changes on the fly if you want to switch to another Epic.
Millarum Dashboards allow to change the focus through a slicer widget that reconfigures the rest of widgets, and one specifically can show open vs. closed work items.
You can try it for free on Jira instances with 10 users or less.
It looks like you're new here. Sign in or register to get started.