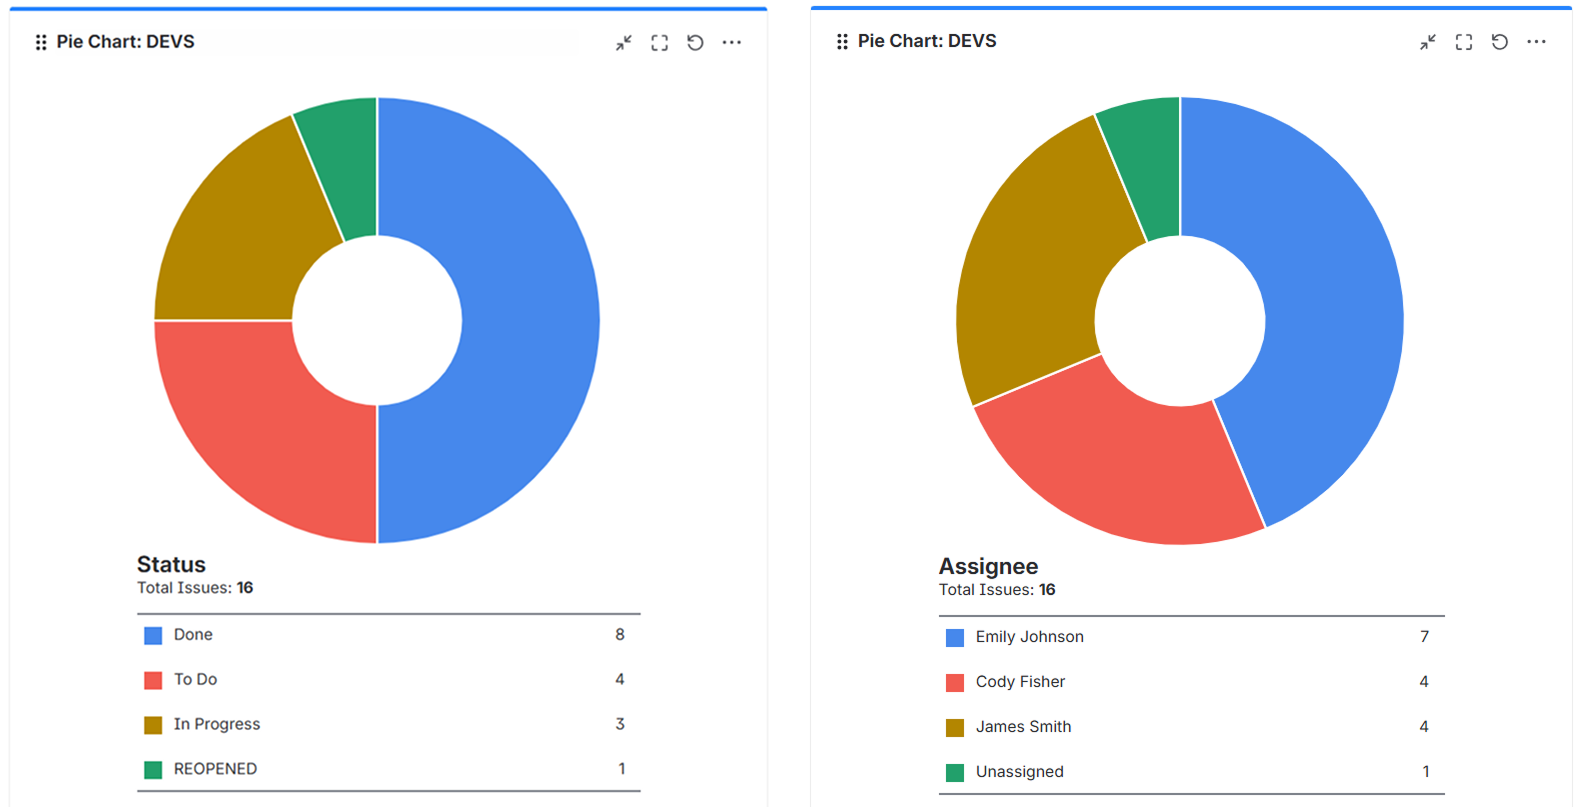
Hi everyone! I'm new to Jira (Cloud), and I'm struggling with Jira reports and Jira reporting in general.
I have to build a monthly dashboard showing how much our teams deliver vs. what's planned - basically a progress-against-target view. I also need to show a velocity trend over time.
I've looked at the default reports (velocity chart, burndown, etc.), but they feel really limited - I can't group by month, can't add a target line, and there's no way to combine data from multiple projects into one view.
What I really need is something executive-friendly - visual charts that non-technical stakeholders can actually understand at a glance. Think burnup with a goal line, cumulative flow, maybe a workload overview per team member.
Is there a way to do this natively, or do I need a dashboard gadget/add-on for this kind of advanced reporting? Any recommendations would be hugely appreciated!