Hi Team,
We were looking for the below data:
when sprint is selected the below details should be displayed in
Total capacity hours planned capacity hours completed capacity hours
300 200 100
Capacity Planned
---------- ----------
Name: Capacity Name: Capacity:
User-1 30H user-1 10H
user-2 20H user-2 10H
User-3 15H User-3 10H
Specifically, I am looking to:
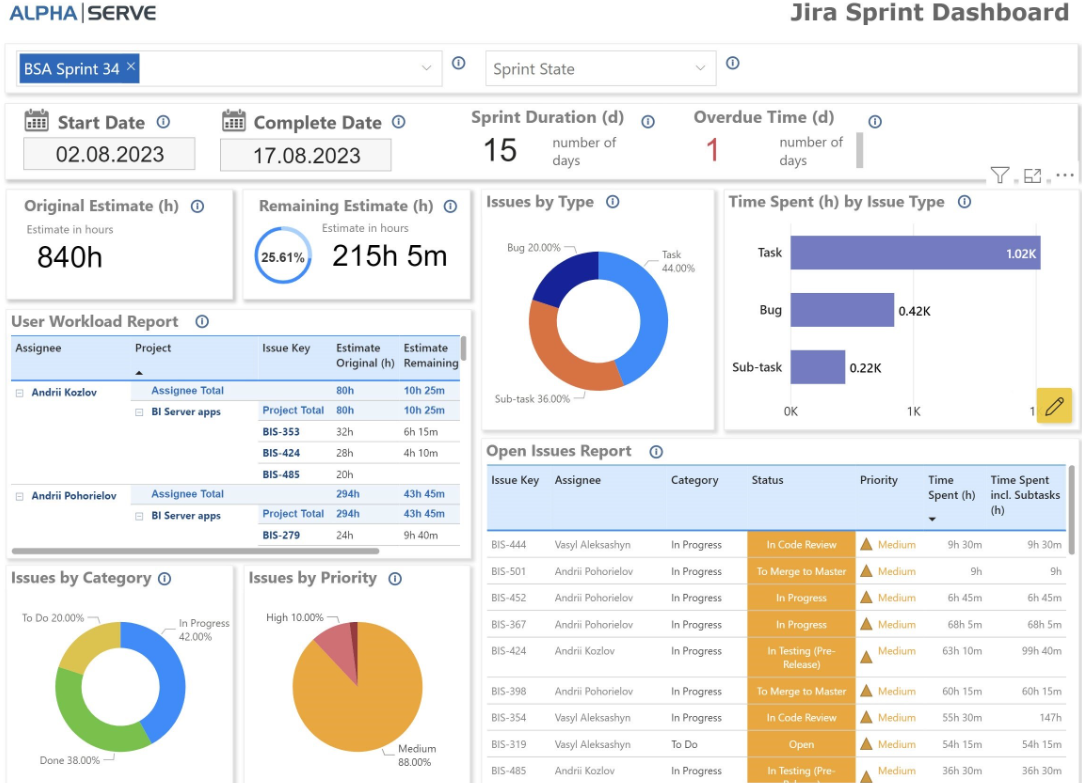
- Create graphs that show the time spent on various tasks over a specific period.
- Visualize the progress of issues based on logged work hours.
I am looking the report like as the attached screenshot.
Any insights, tutorials, or examples would be greatly appreciated!
Thank you in advance for your assistance.