Thus, despite having powerful features to create workarounds for the reopening rate of issues, Jira does not allow for comprehensive reporting on this metric out of the box. The great thing about the Atlassian ecosystem is that we can find various reporting tools specifically designed for this purpose! Let’s take a look at them.
Jira apps to monitor closed vs. reopened issues compared 📊
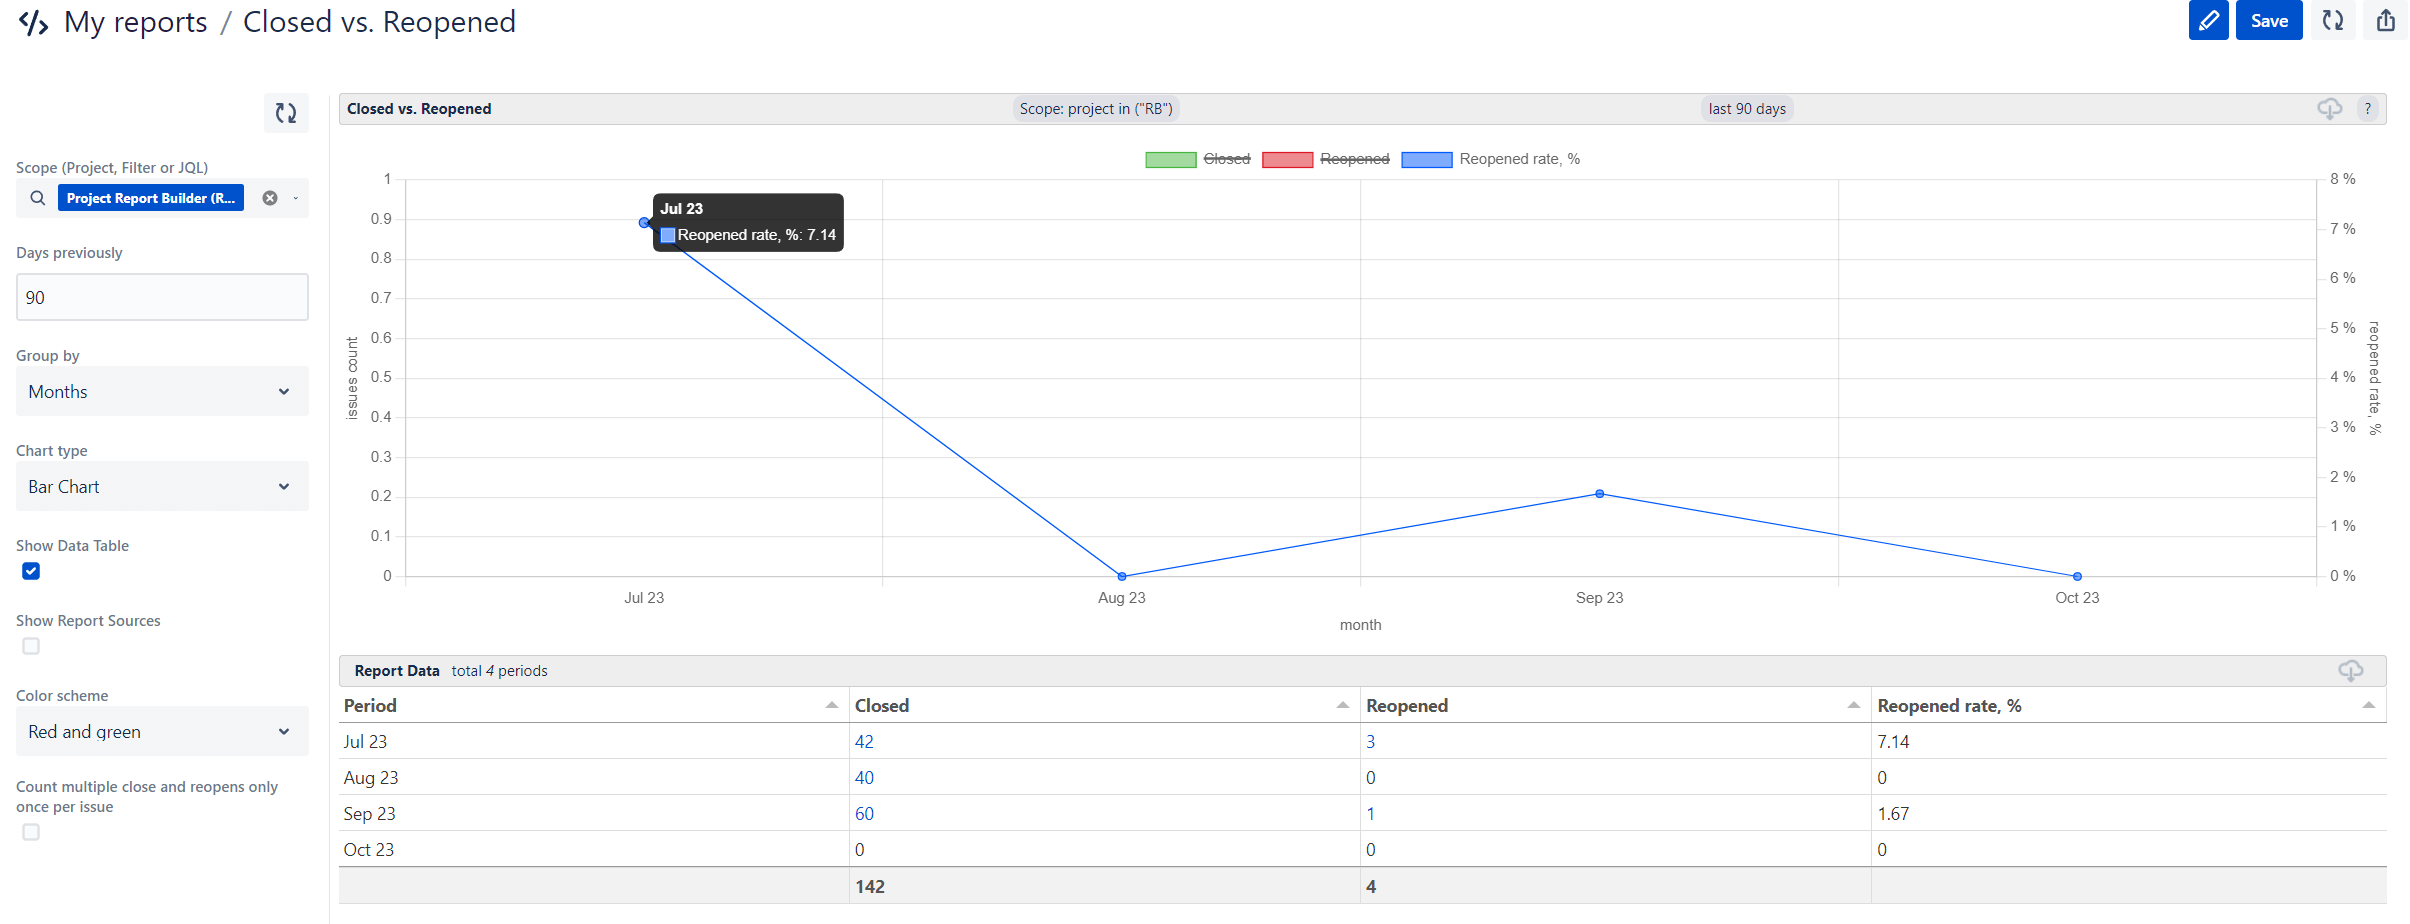
You could use many apps to report against ticket Reopens. Since issue reopens case is always related with status and status category change, we selected a number of popular Jira reporting apps allowing you to report against statuses, time in status and transitions from one status to another. We will now look at the selected applications together:
Make sure you have established the required scope of Jira projects to be imported into EazyBI as a data source. Don’t forget to establish regular updates to ensure that you report against actual data.
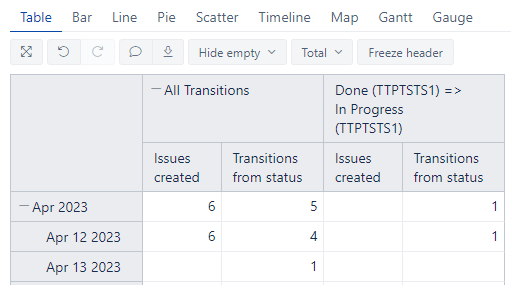
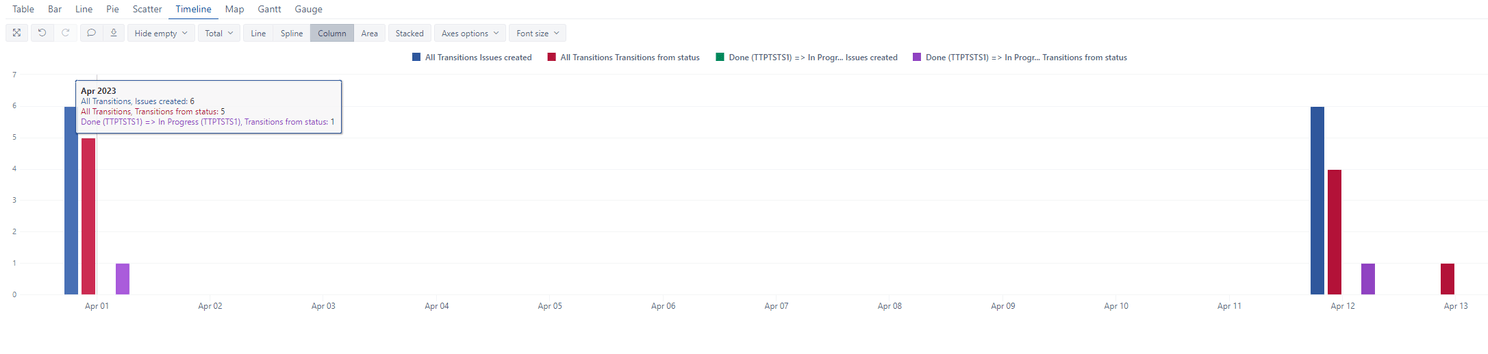
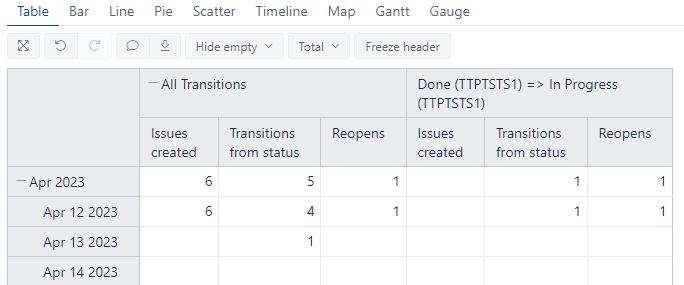
No-coding variant: You can create a new Jira report and use the “Transitions from status” pre-defined measure, which will provide you with a view of all transitions that have occurred on your Jira issues. When using this measure in the “Columns” section of the report, and using the “Time” dimension in the “Rows” section of the report, you will get a nice-looking report. You can remove unnecessary transitions to only see those that you consider as reopens.
In our example, we only considered transitions from “Done” to “In progress” status.





![Photo of Emre Toptancı [OBSS]](https://us.v-cdn.net/6038660/uploads/avatars/88/25/n8825d1e863017fd80882ab56e7550387.png)


