Howdy, everyone!
This post is intended to help people monitor their Service Projects for mail handler errors that may not be noticed until a manual check of the Processing log page is performed.
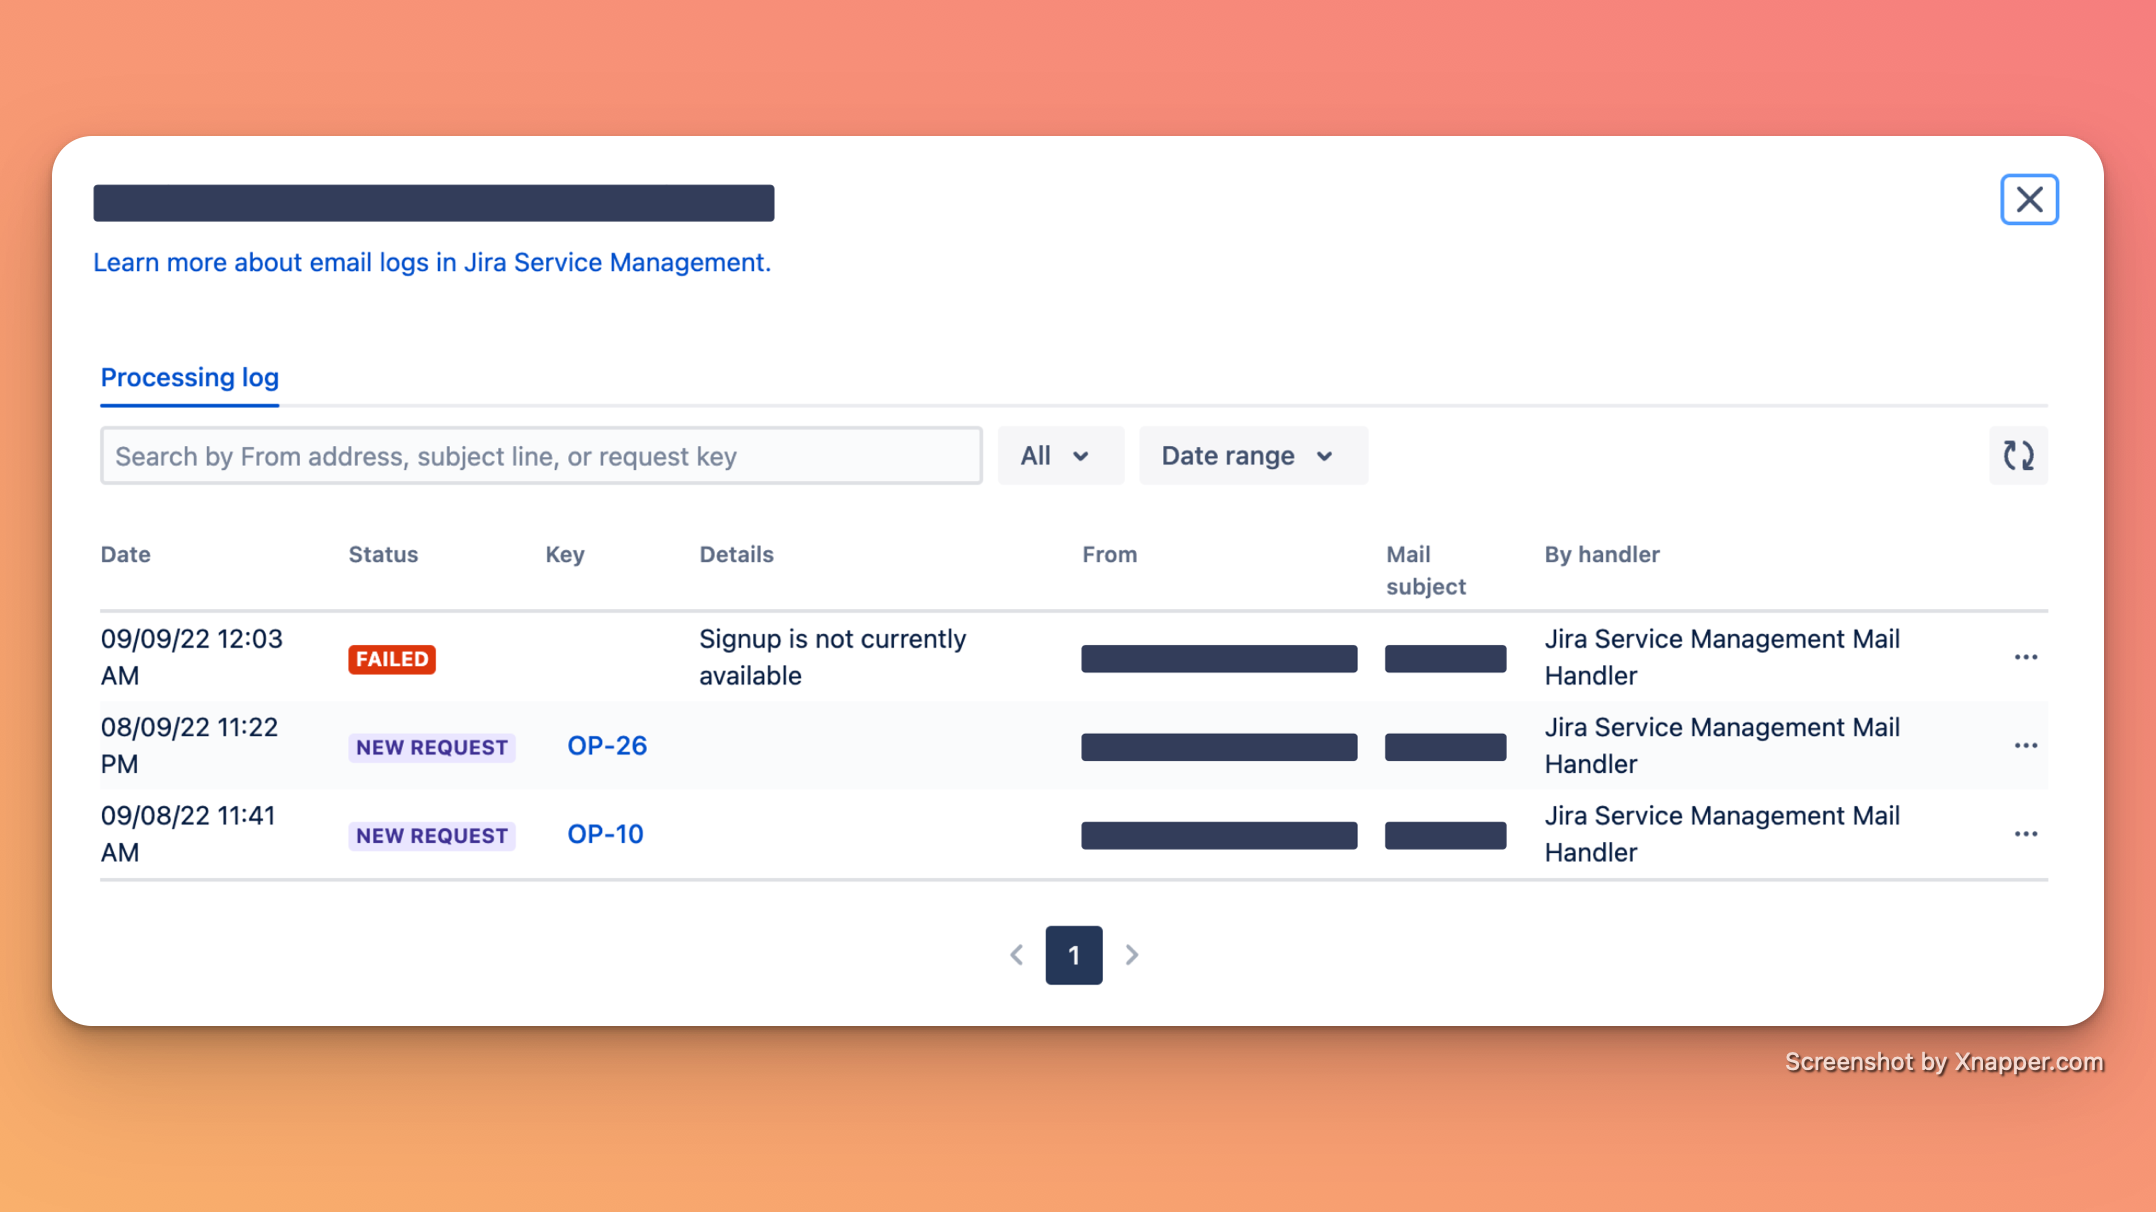
This is also very requested by many of you and after playing with Jira Automation and API for a while now, I finally found a way to make this happen within Jira.
How does this work?
Jira Service Management has an internal endpoint that programmatically returns the same information we see on the Processing log page. The idea here will be to create a scheduled automation rule that will check this endpoint for error logs, format them and forward this to the email address you specify.
But before we proceed, there are a few things that are important to mention:
-
It will be necessary to have an Atlassian account with a Jira Service Management license and Project Administrator permission in the Service Projects you want to monitor the mail handlers;
-
It is highly recommended for this account to be a service account because its API Key will be exposed in one of the rule’s components.
How can we build this rule?
To ease this guide, we will split it into four parts.
Step 1 - Discovering the endpoint
Each Jira Service Management mail handler has its unique Channel Identifier, which can difficult things a bit, but stick with me as we make this into a piece of cake.
-
Go to your Service Project mail handlers settings:
-
For company-managed: Project Settings > Email Requests
-
For team-managed: Service Project settings > Channels > Email
-
Open your Browser’s Developer Tools and switch to the Network Tab
-
Click on View logs for the mail handler you want to get the channel identifier
-
This should record a few endpoint requests, but we need to find one similar to:
https://instance.atlassian.net/rest/jira-email-processor-plugin/1.0/mail/audit/process/CHANNELXXXXXXXXXXXX?limit=50&page-1
-
When you find it, copy the CHANNELXXXXXXXXXXXX to somewhere you can easily get it later like a text editor
To be sure you found the correct endpoint, you can simply copy the endpoint and open a new tab, the result should be a JSON structure similar to this:
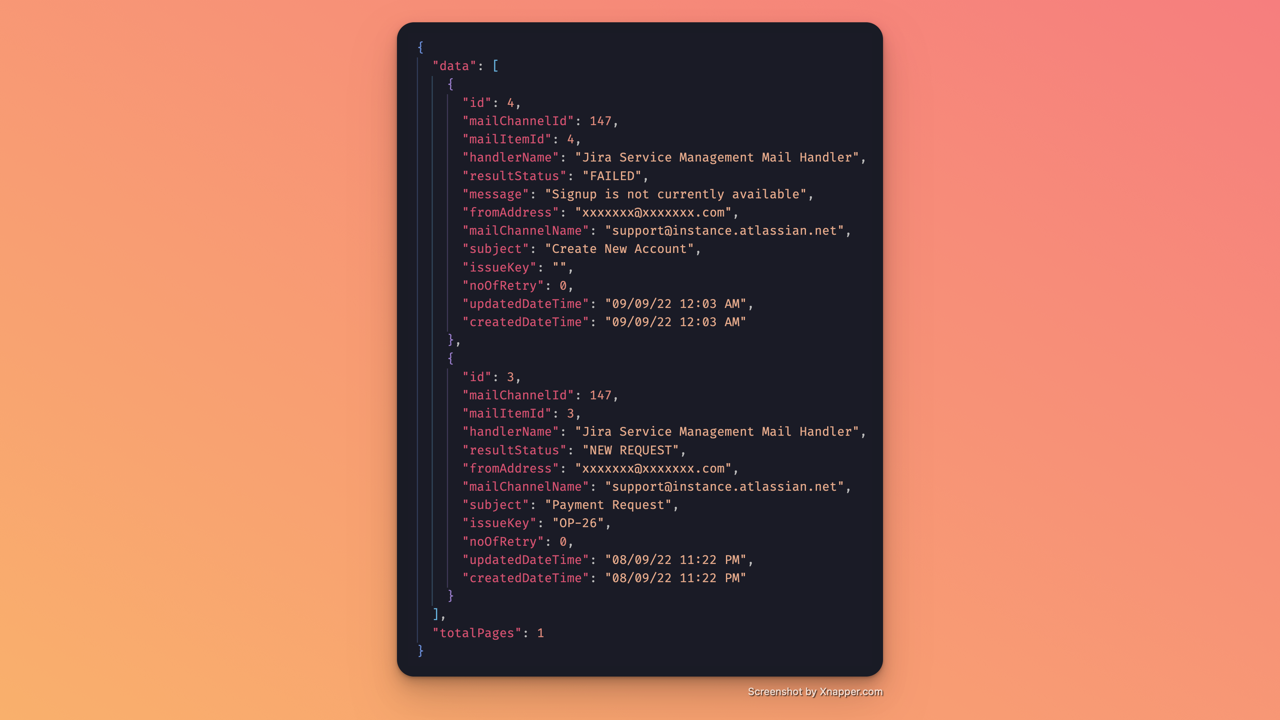
Here is a quick recording showing how to achieve this:

Step 2 - Generating an API Key
Even though we have found the endpoint to retrieve the logs, we still need to be authenticated to access this information and to achieve that we will need an Atlassian account with Project Administrator permission, a Jira Service Management license, and its API Key. After deciding which account to use, follow this guide to create its API Key.
Step 3 - Encoding credentials
You can encode the credentials yourself by opening your Browser's Developer Tools. In the Console tab, type in the following and click enter:
encodedData = "Basic " + window.btoa('ATLASSIAN_ACCOUNT_EMAIL:API_KEY')
You'll need to substitute both the ATLASSIAN_ACCOUNT_EMAIL and API_KEY with the chosen account credentials, like this:
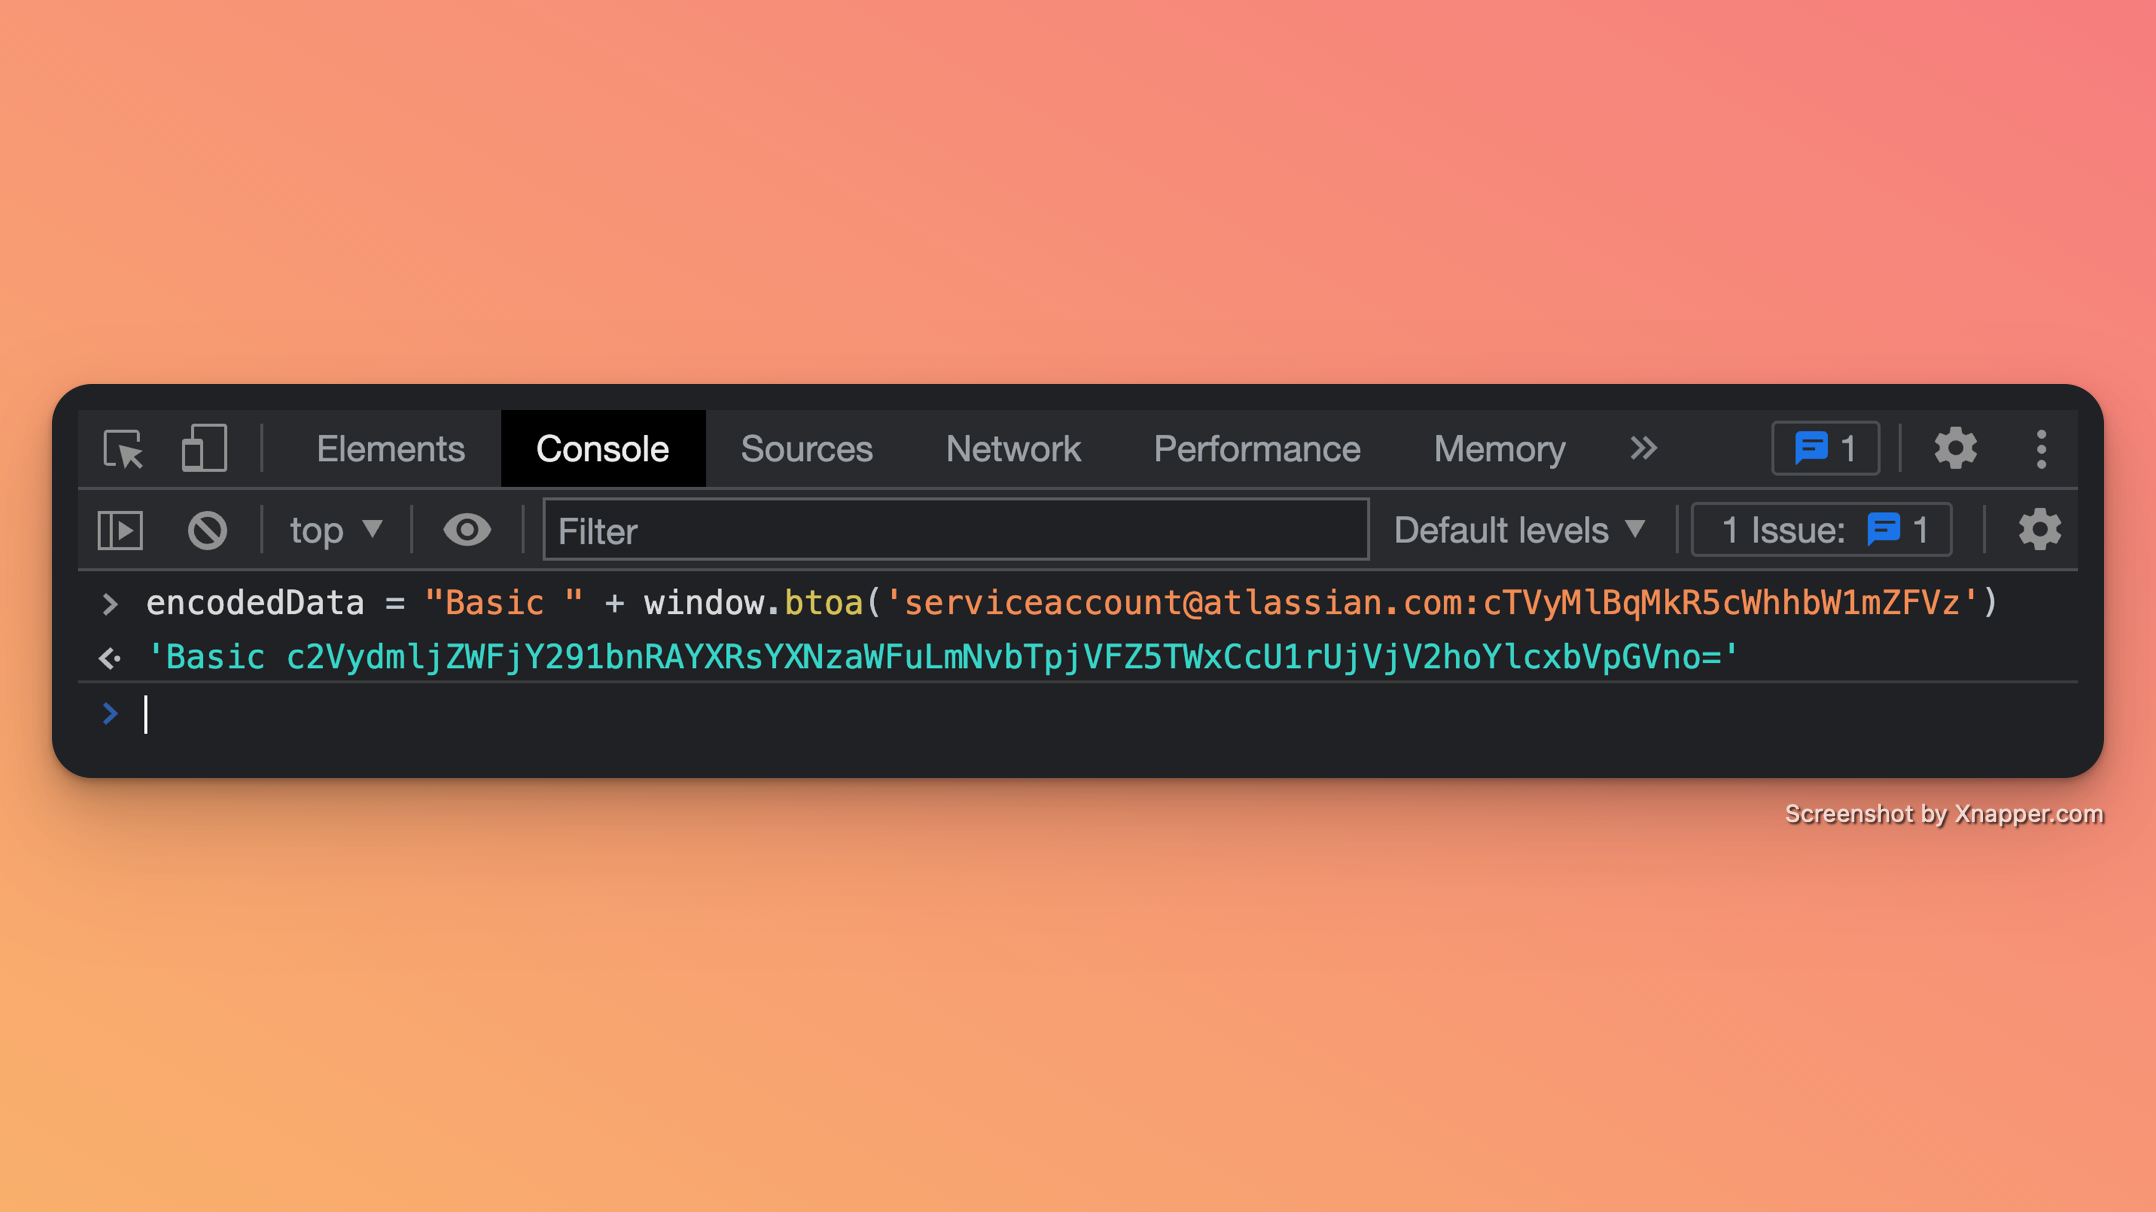
Copy this value (without quotation marks) to somewhere you can easily get it later like a text editor.
Step 4 - Build the automation rule
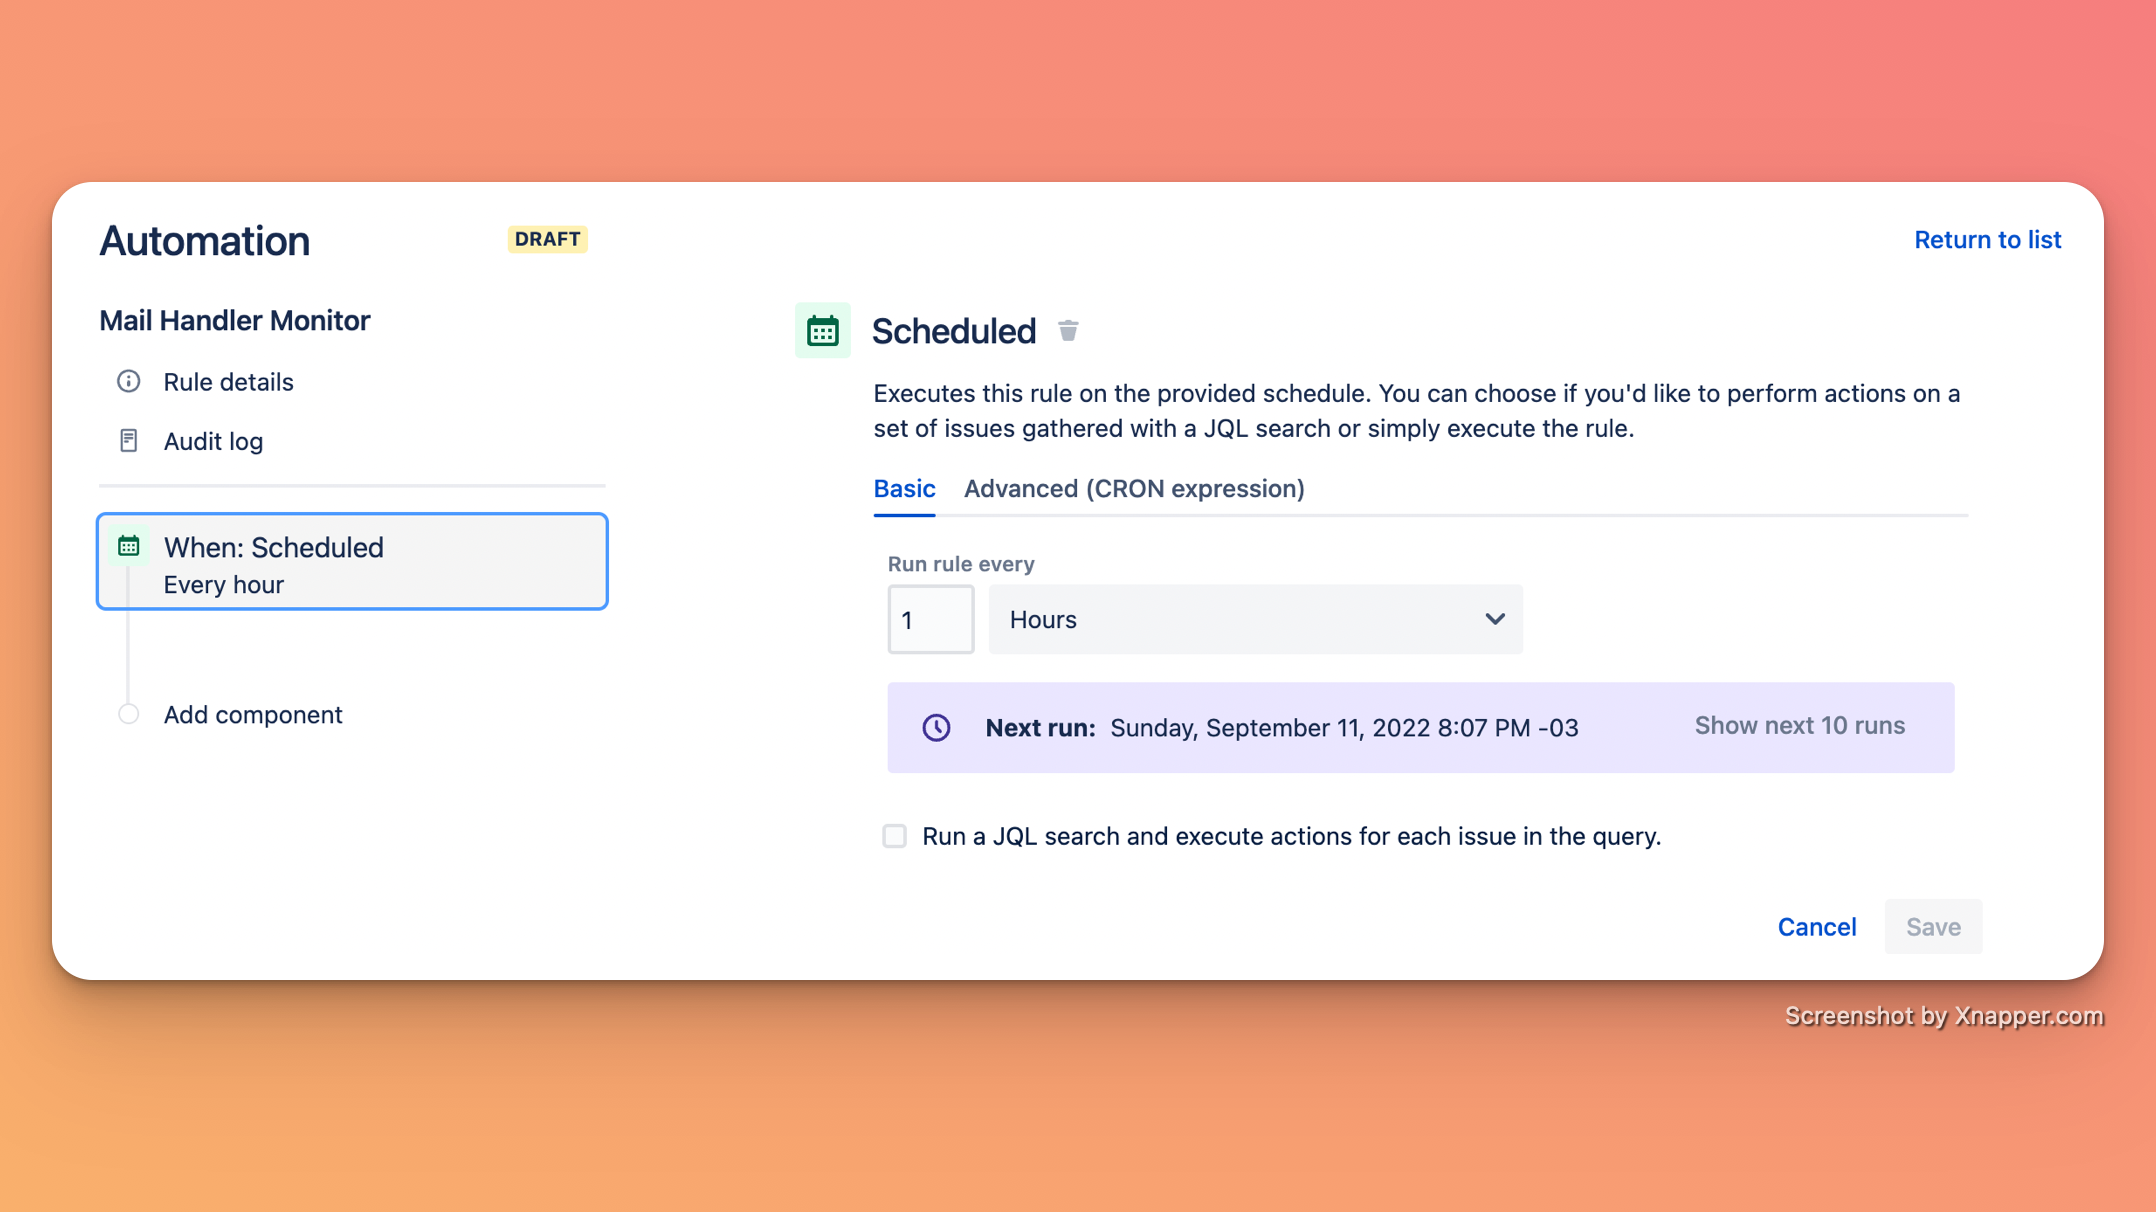
The final piece in this puzzle… the automation rule. Go to your Project Settings > Automation and start a new rule in the following components:
Scheduled Trigger: The frequency will be up to you, but for the sake of the example, let’s set it to run every hour.
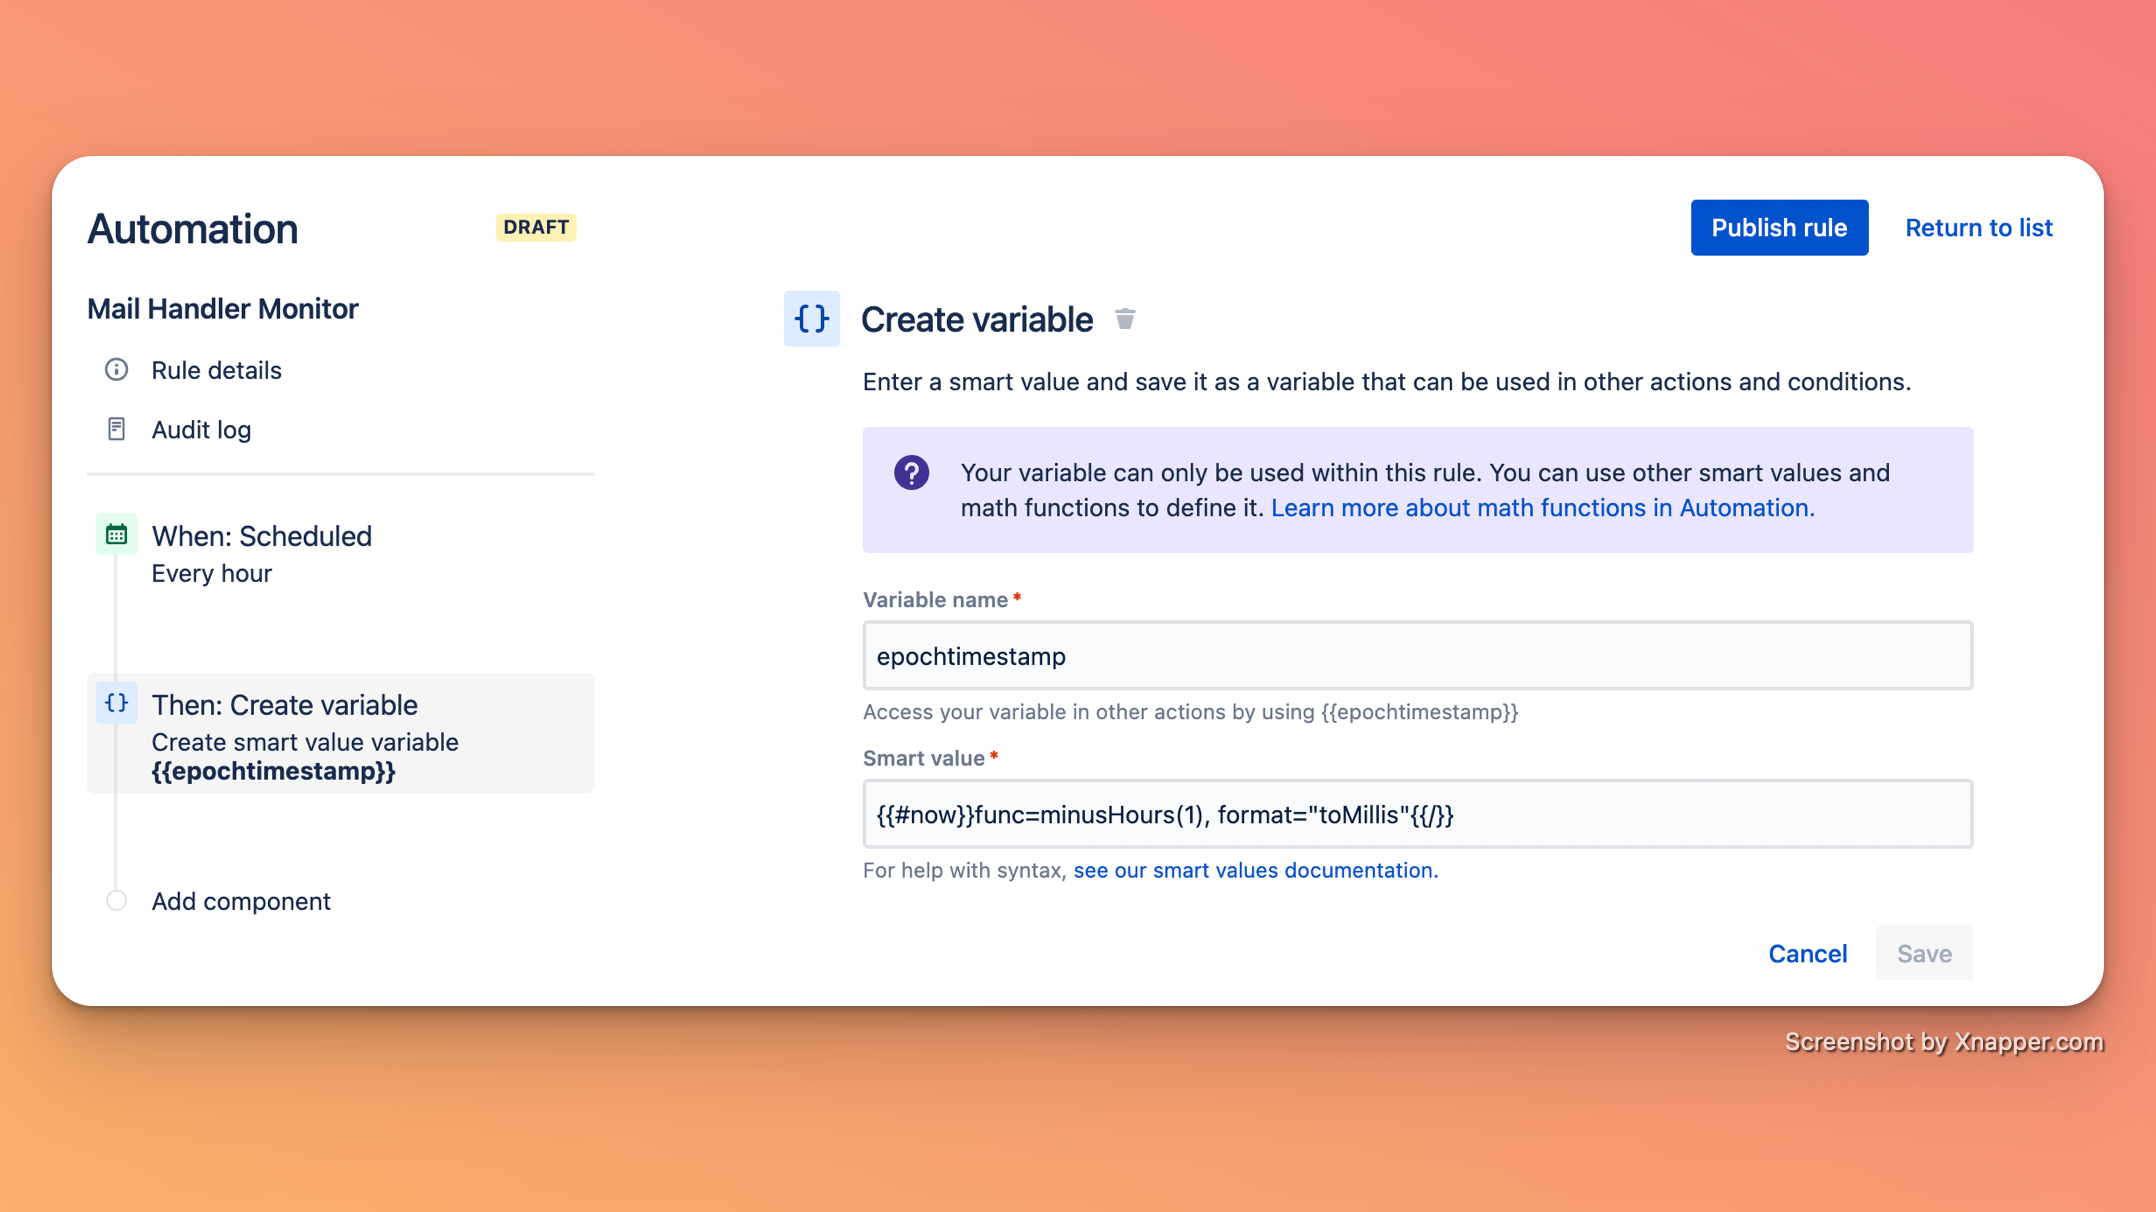
Create variable: This variable will be used in the endpoint we saved earlier as an epoch time. This is necessary to limit the logs by date, otherwise, you would keep retrieving the same errors every day.
-
Variable name: epochtimestamp (suggestion)
-
Smart value: {{#now}}func=minusHours(1), format="toMillis"{{/}}
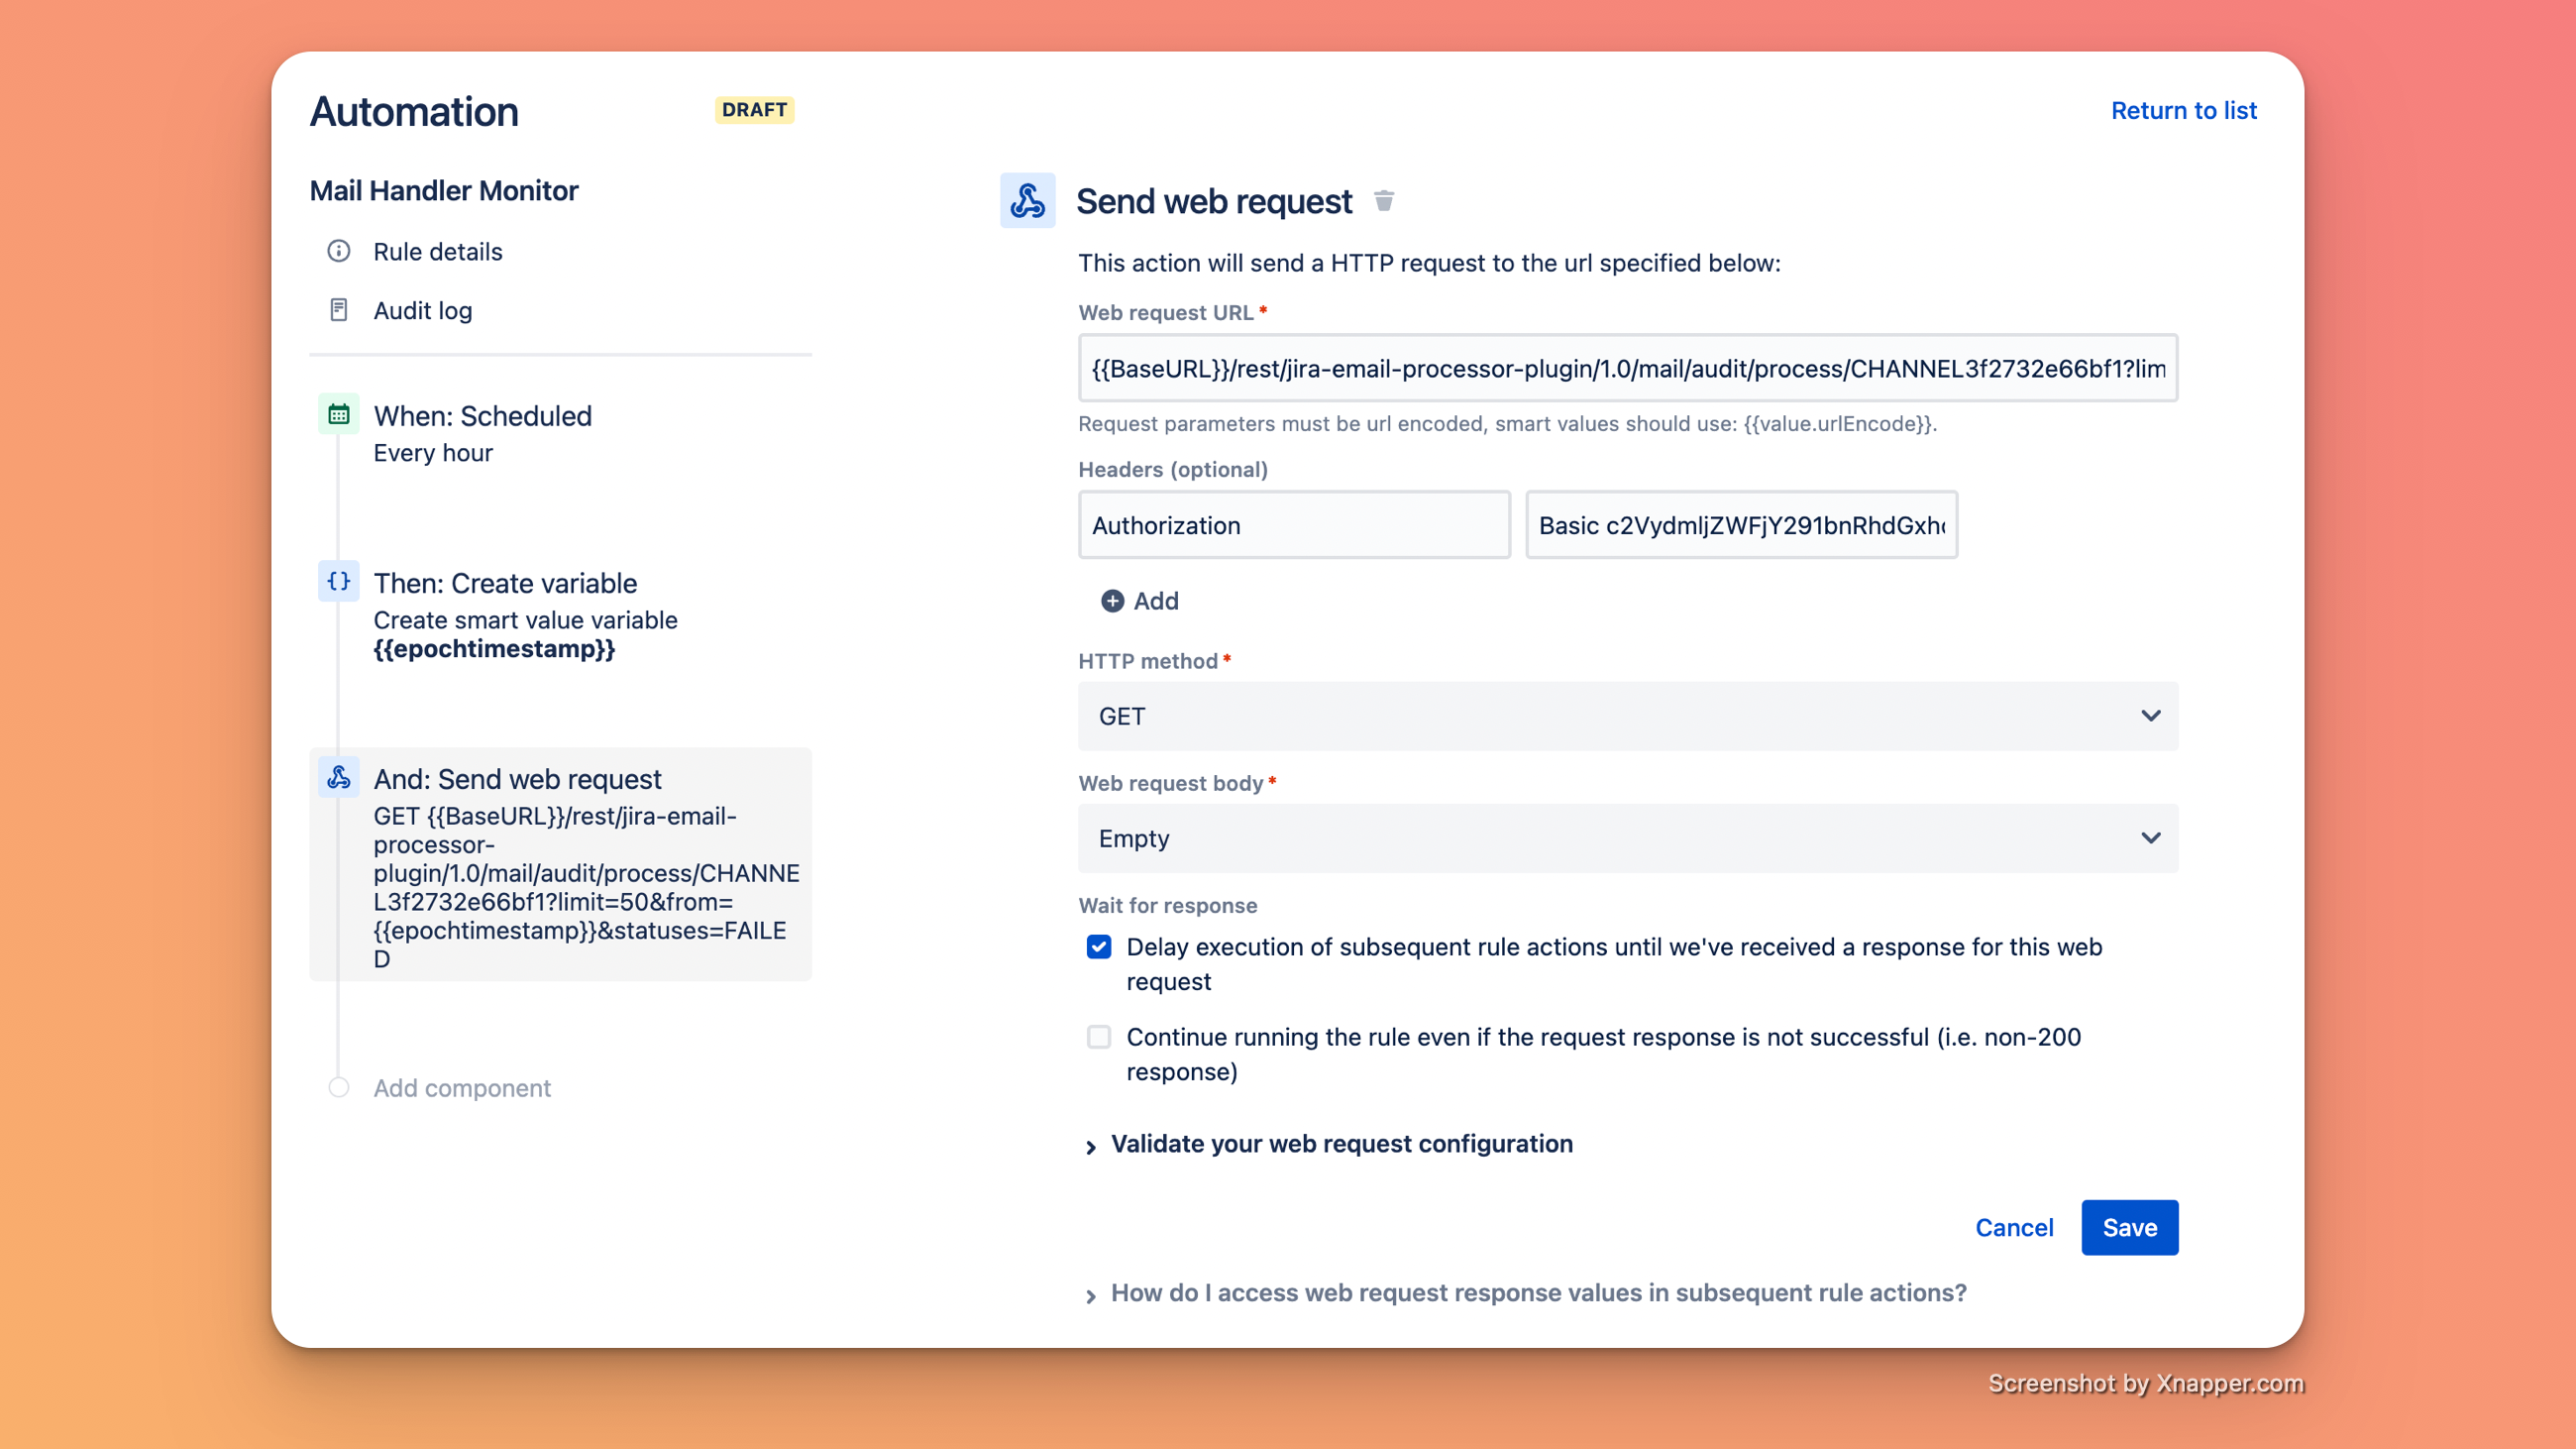
Send Web Request: The component where all things come together. Here we will programmatically simulate the action to open the Processing log page.
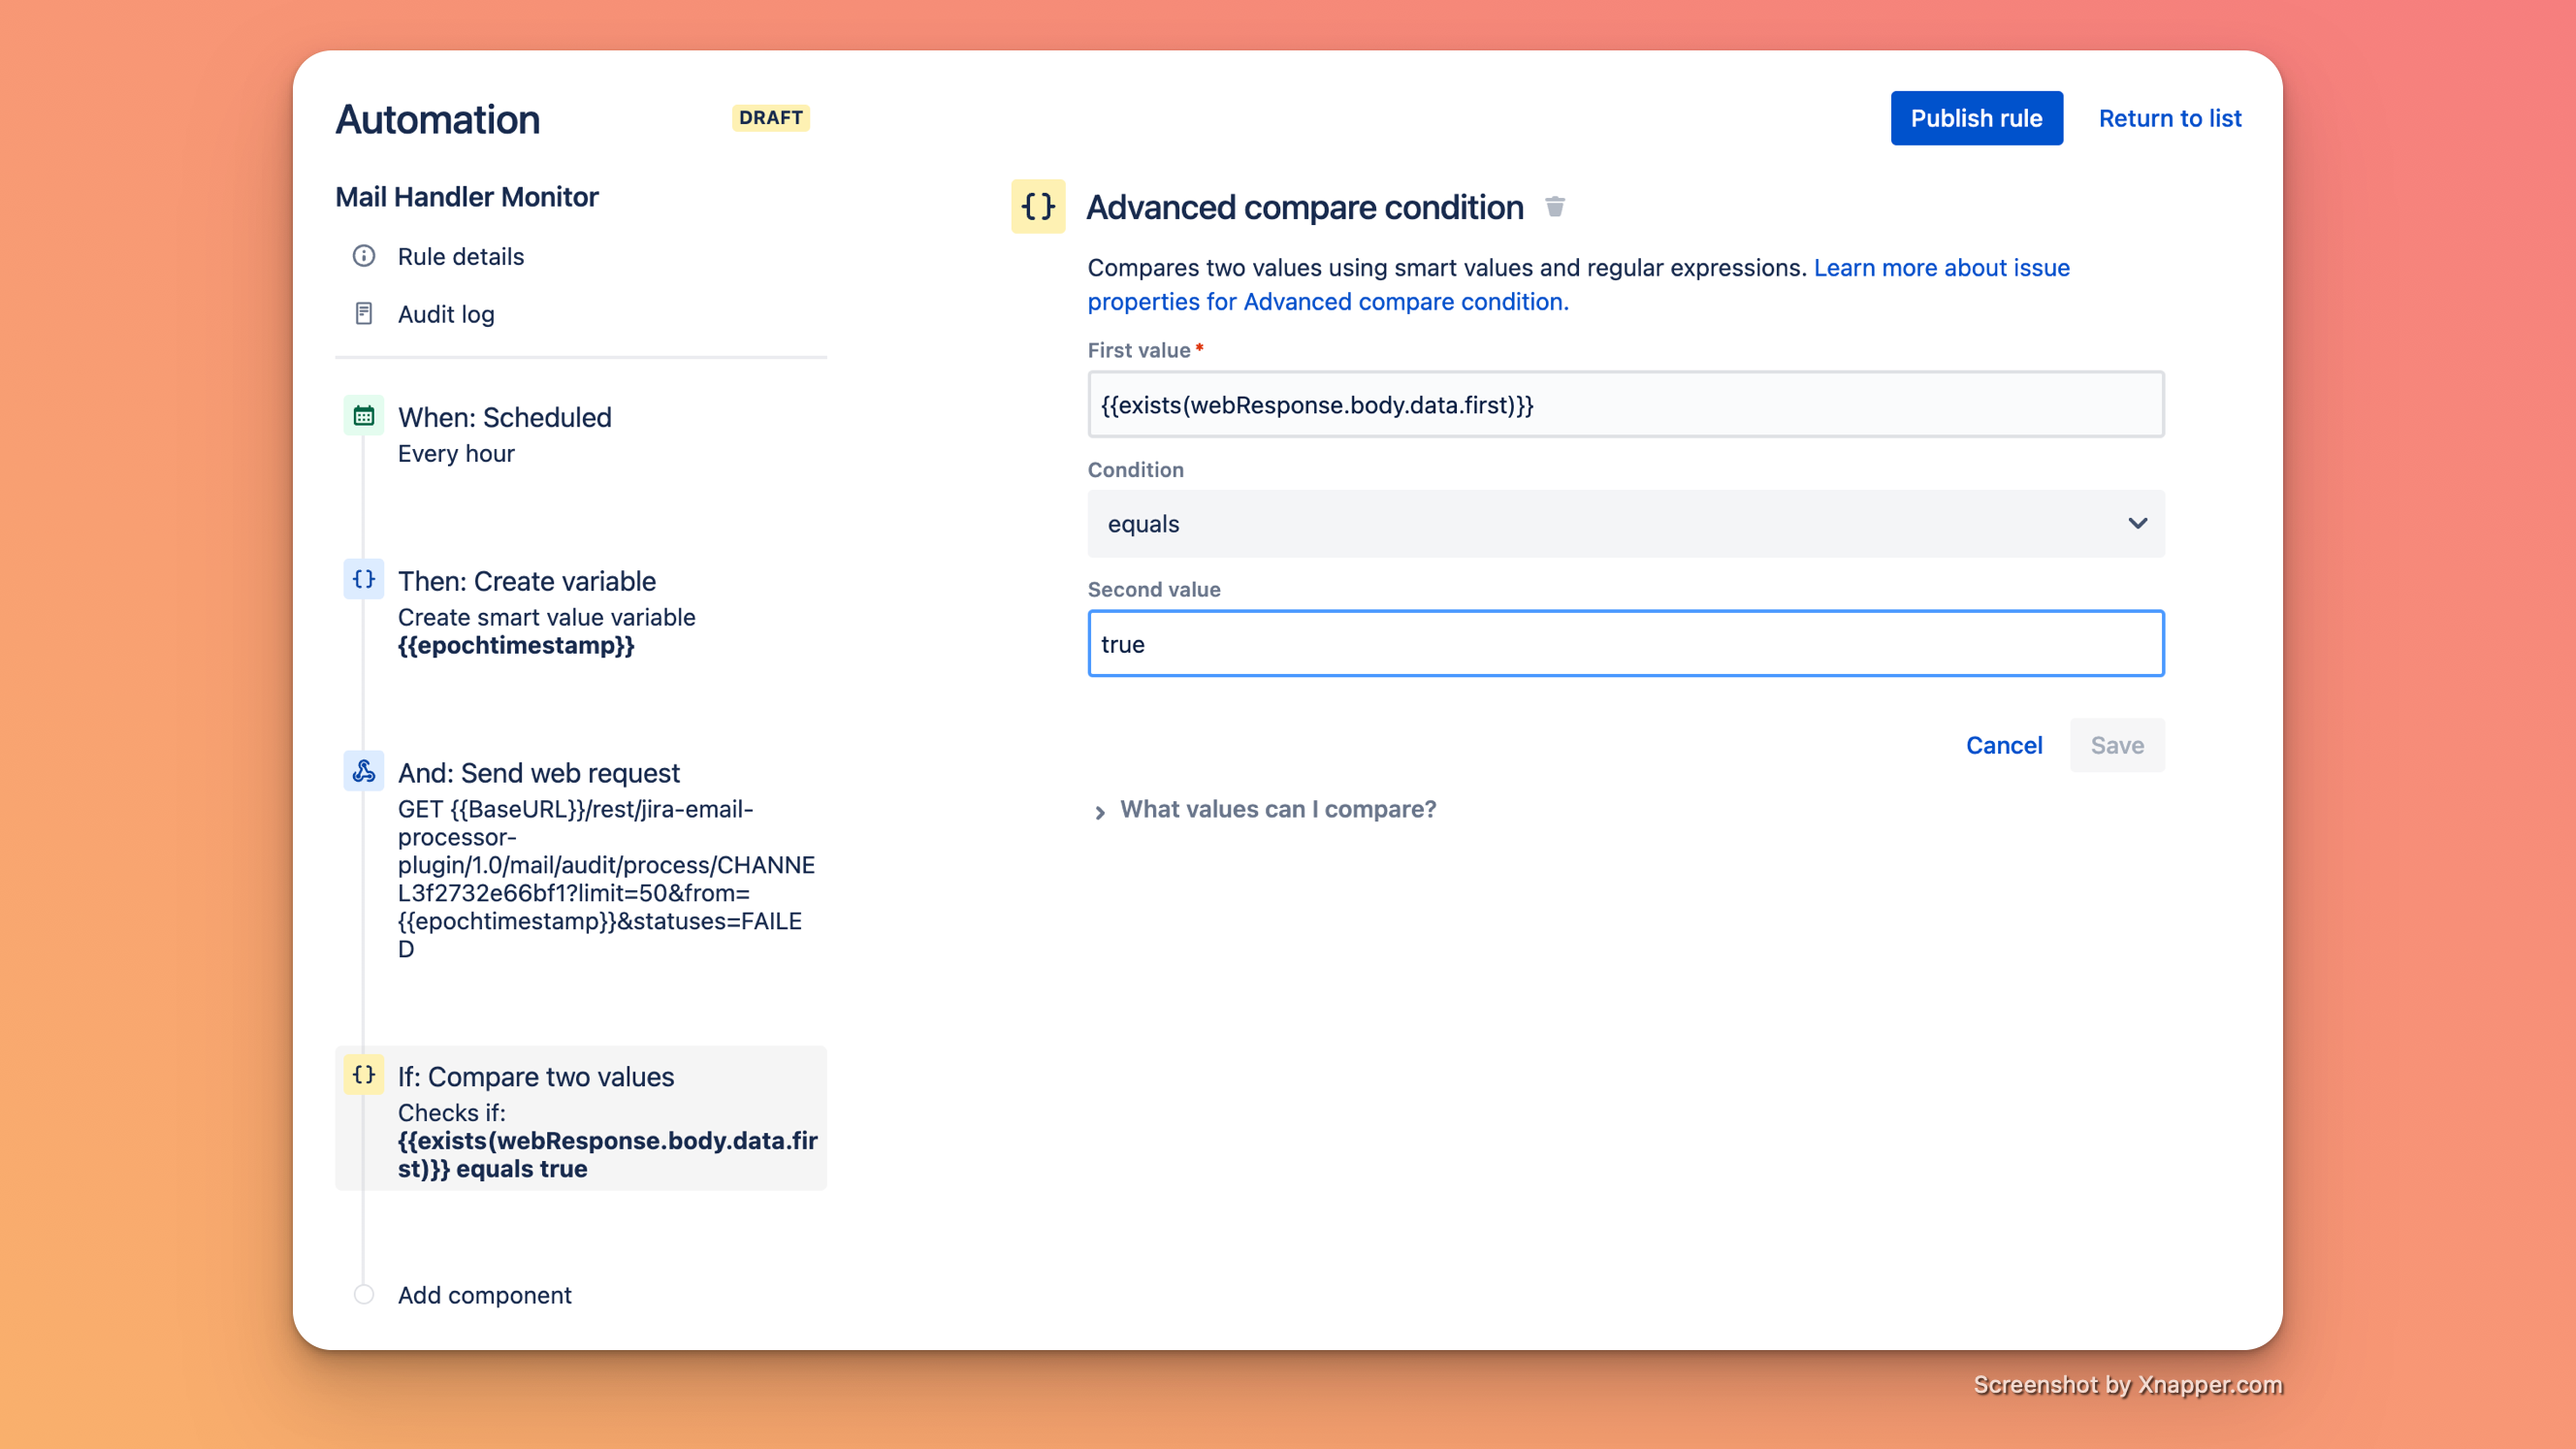
Advanced Compare Condition: A simple verification to avoid sending notifications without errors.
Send Email: The last component of our rule, responsible to notify the administrators about the errors in your Jira Service Management mail handlers.
-
To: Here you can select Jira groups or add email addresses manually
-
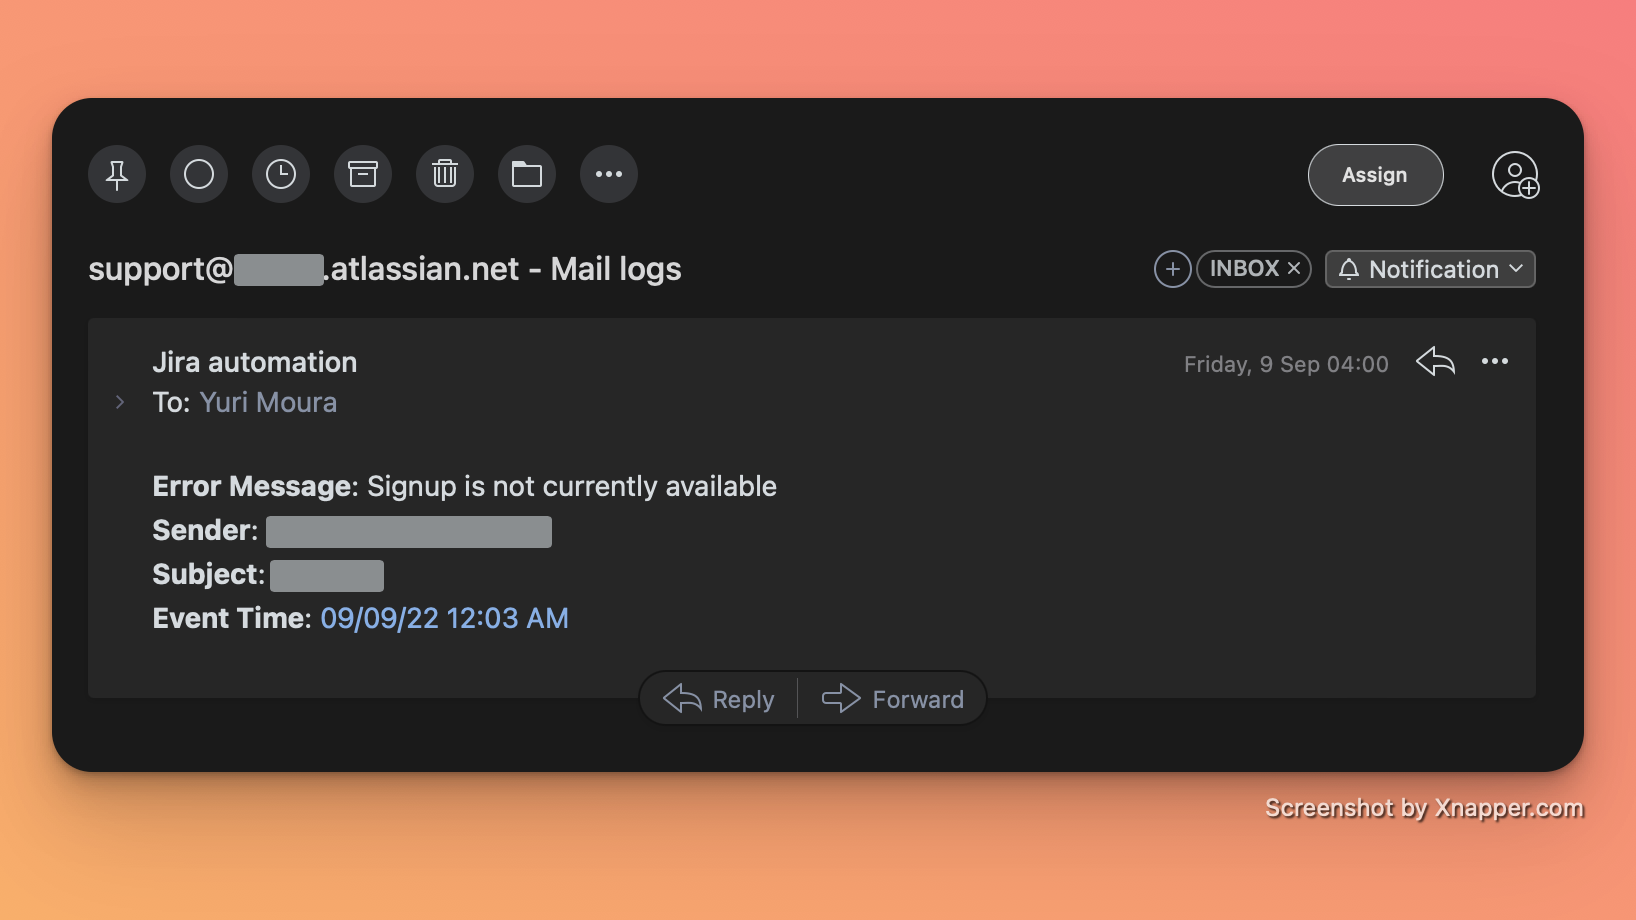
Subject: {{webResponse.body.data.first.mailChannelName}} - Mail logs (suggestion)
-
Content:
{{#webResponse.body.data}}
<b>Error Message</b>: {{message}}
<b>Sender</b>: {{fromAddress}}
<b>Subject</b>: {{subject}}
<b>Event Time</b>: {{createdDateTime}}
---

{{/}}
-
I will not dive into these smartvalues in this article, but I can tell we are using list expressions and HTML here to format our notification based on the Send Web Request response. If you want to learn more about it, you can check Smart Values - Example with lists.
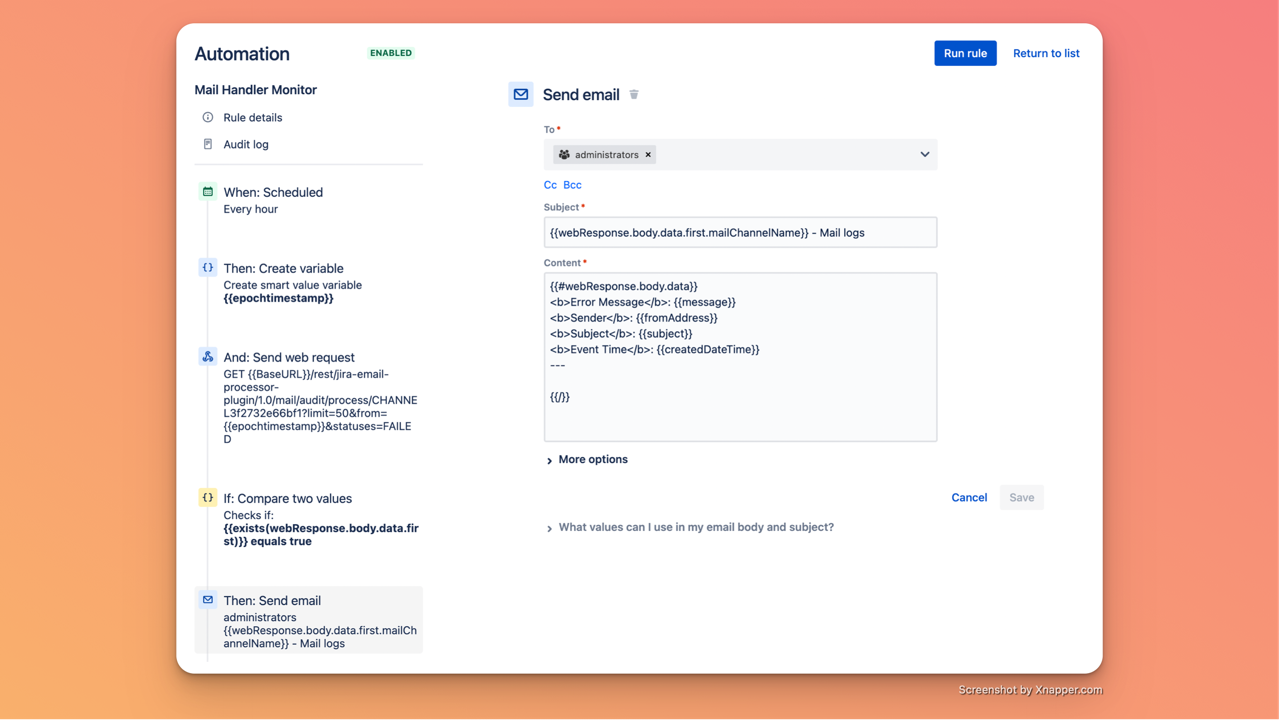
Finish your rule by giving it a name, and be sure you leave it enabled.
Example
After that, the result should be similar to the image below which matches perfectly with what we saw at the beginning of this page:
Additional Resources
It isn't as good as a native solution, but I hope it will be useful for many of you until Jira Service Management makes it natively available.
Here are some additional links for anyone interested in learning more about Jira Automation, as well as two rules that you can easily import into your Atlassian site based on what we reviewed:
Automation Rules
-
Rule #1 - Alert Admins: This is exactly what we saw here, ready to be imported. ( Download Link)
-
Rule #2 - Alert Sender: Following the previous rule, this one will notify the senders if their emails were not processed. (Download Link)
 Both rules require you to replace the Credentials and Channel Id.
Related Feature Request
Official Documentation
External Documentation


