Hi All
Greetings for the second time today! I'm on a roll.
I've created the dashboard in the screen grab using Qotilabs Rich Filters v1.21.1. It's still a work in progress however after posting here I've managed to understand how Jira works and how the current sprint, future sprint and backlog issue counts are calculated.
So firstly thanks to everyone that's replied to my previous posts!
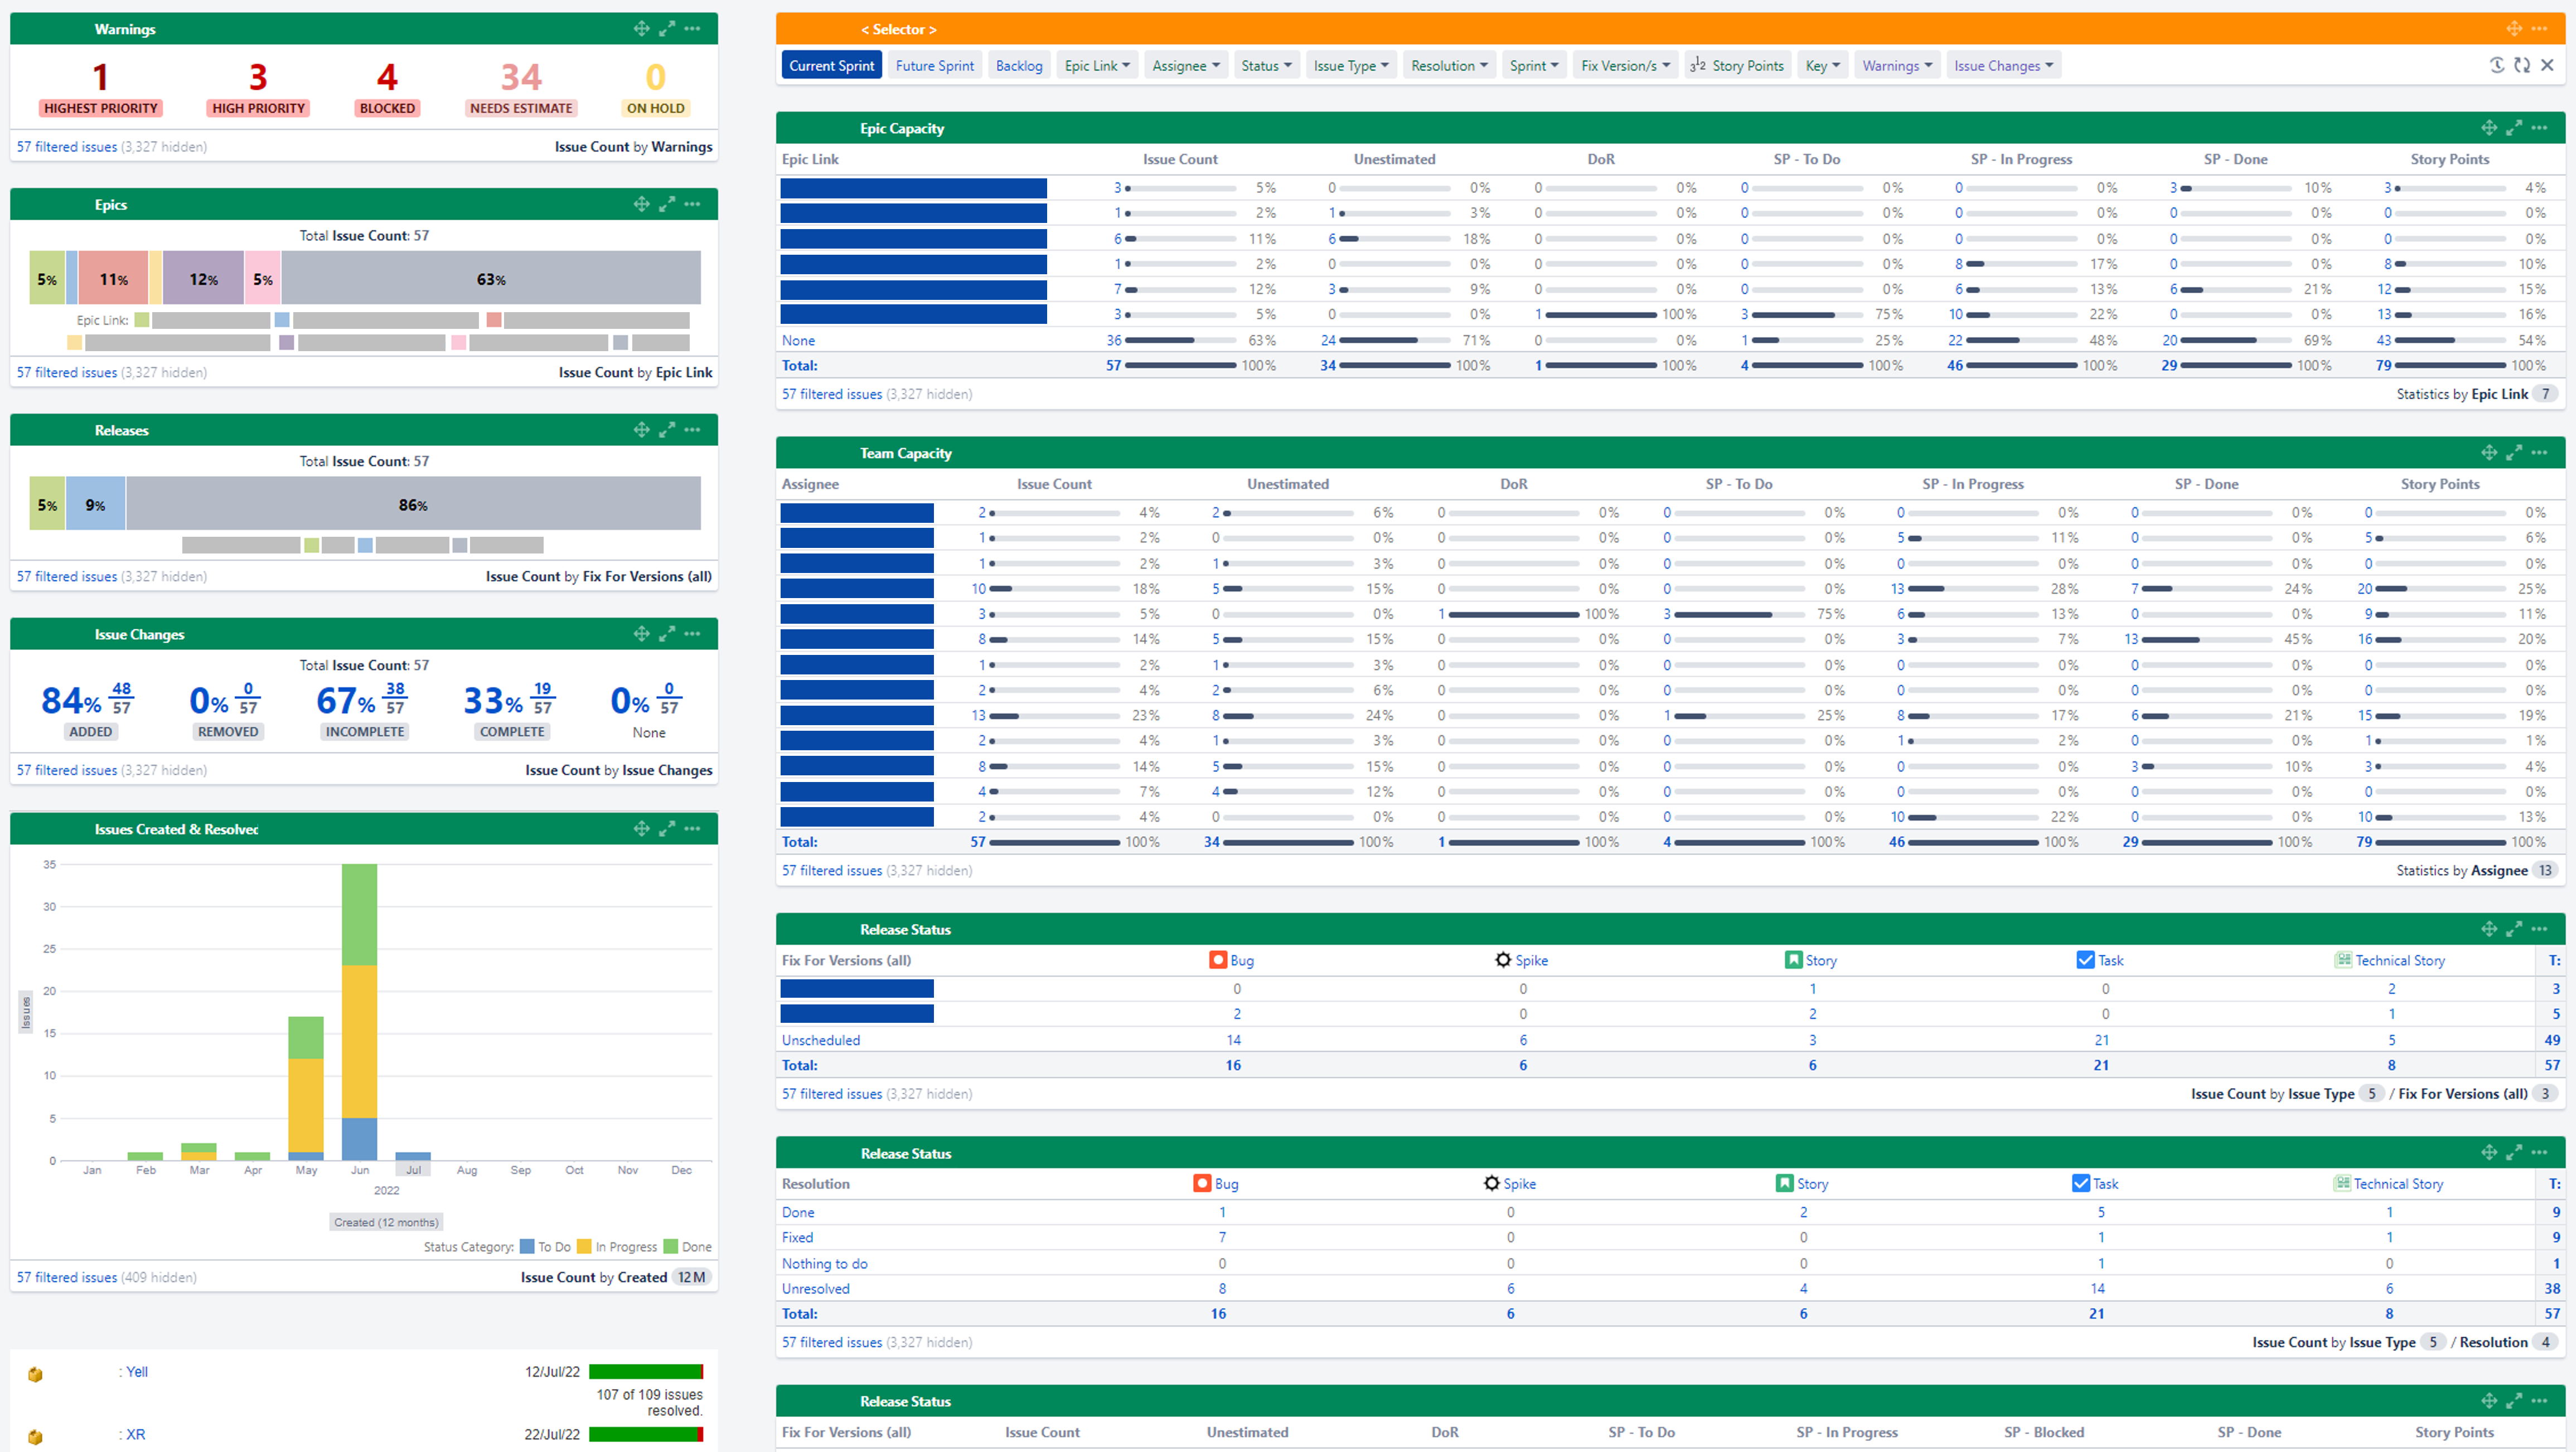
I'd like to use the Rich Filter Smart Gauges Gadget to visualise a count of the created date by ranges e.g.:
- Issues created from Now() and -10 days
- Issues created between -10 days and -20 days
- Issues created between -20 days and -30 days
- Issues created between -30 days and -50 days
- Issues created between -50 days and -75 days
- Issues created greater than -75 days
This 6 gadget cluster will provide a useful insight into the aging of the issues being added to the current and future sprints, and provide the same with the larger backlog issues (in terms of ageing) when the backlog is selected from the Rich Filter Controller Gadget.
You'll appreciate that if I use an absolutely date range then the filter will need changing, so it has to be a relative date range.
Is there any method of doing this please?
As usual, thanks to anyone that takes the time to respond.
Stay holy, happy & healthy!
Regards
Hardip


