Community resources
Community resources
Community resources
OpenTelemetry traces for Bitbucket Pipelines via webhooks
Hi Bitbucket Community!
Bitbucket Pipelines now exposes pipeline execution as OpenTelemetry (OTel) traces via webhook events. This lets you stream detailed pipeline spans into your own observability stack and correlate them with the rest of your system.
This post walks through:
-
What pipeline traces are
-
The spans we emit (run, step, command, container)
-
How to consume them via webhooks
-
How to use them in your observability tools
Why pipeline traces?
Pipelines are critical infrastructure: they gate releases, consume shared compute, and are often the first thing teams blame when deployments slow down. But traditional signals (build status, logs, basic timing) make it hard to answer questions like:
-
Which part of the pipeline is slow — setup, tests, or deploy?
-
Are we hitting CPU/memory limits on our build containers?
-
How does a particular pipeline run relate to application traces and incidents?
OpenTelemetry traces give you:
-
End‑to‑end visibility of a pipeline run as a trace
-
Structured spans for each step and command
-
Resource metrics (CPU/memory) at the container level
-
A standard format you can ingest into tools like Grafana, Datadog, Honeycomb, etc.
How pipeline traces are delivered
Pipeline traces are delivered as Bitbucket webhook events. You enable them on a per‑repository basis:
-
Go to your repo in Bitbucket.
-
Navigate to Repository settings → Webhooks.
-
Create or edit a webhook that points to your trace ingestion endpoint.
-
Select
OTEL Tracesas the webhook under pipelines section.
-
Each webhook payload contains a resourceSpans array compatible with OpenTelemetry’s JSON representation. Within that you’ll see several span types that model the pipeline execution.
The span model
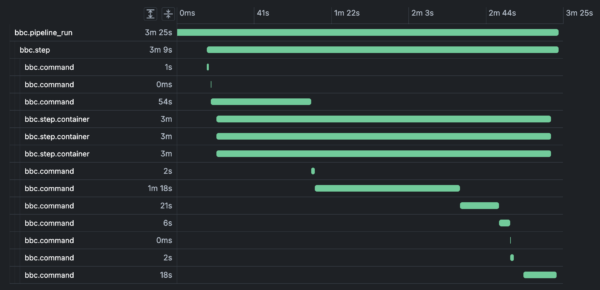
The trace hierarchy is:
-
Pipeline run span (root)
-
Step spans
-
Command spans
-
Container spans (as attributes on spans for the containers used by steps)
-
-
We use bbc.* namespaced span names to distinguish Bitbucket Pipelines spans.
1. Pipeline run span
The pipeline run span represents a single execution of a pipeline: its trigger, result, and basic metadata.Sample
Key attributes to care about:
-
pipeline_run.uuid/pipeline.uuid– stable IDs for the run and pipeline definition -
pipeline.build_number,pipeline_run.run_number– the build/run numbers you see in the UI -
pipeline.state.result.name–COMPLETE,FAILED, etc. -
pipeline.target.ref_type,pipeline.target.ref_name– branch/tag information -
pipeline.trigger.name–MANUAL,SCHEDULED,PUSH, etc.
This span gives you the top‑level trace you can correlate with other traces (for example, application deploy traces).
2. Step span
Each pipeline step is represented as a bbc.step span, child of the pipeline run.Sample
With this you can:
-
Identify slow or flaky steps (
step.duration_in_seconds,step.state.result.name) -
Group spans by
step.uuidacross commands and containers -
Compare resource usage per step once you join with container spans
3. Command span
Within each step we emit bbc.command spans for setup, teardown, and user commands. These are the most granular spans and are extremely useful for drill‑down performance analysis.Sample
Notable attributes:
-
command.command– the shell command that ran (ls /sys,sleep 5s,SETUP,TEARDOWN, etc.) -
command.duration_in_seconds– execution time per command -
command.command_id– stable identifier (e.g.MAIN_0,SETUP,TEARDOWN) -
step.uuid,pipeline_run.uuid,pipeline.uuid– for joining with higher‑level spans
This makes it trivial to answer:
-
Which commands are dominating my step time?
-
Are there expensive setup/teardown phases that should be optimized?
-
How much time are we spending in network or I/O heavy commands?
4. Container span attributes (resource usage)
To understand resource behavior, we emit container metrics as attributes grouped by container name (for example docker for service containers and build for the build container).Sample (abbreviated):
Key attributes:
-
container.name– e.g.build,docker, or service container names -
container.metrics.*– aggregated CPU and memory (mean, p90, max) -
step.uuid,pipeline_run.uuid– link back to the relevant step/run
You can use this to:
-
Detect CPU‑bound or memory‑bound steps
-
Spot containers that consistently hit resource ceilings
-
Tune step size, caching, or parallelism based on actual usage
Consuming traces in your observability stack
Because the payload is OpenTelemetry‑compatible, most observability stacks can ingest it with minimal glue code.
At a high level, you’ll:
-
Expose an ingestion endpoint that accepts Bitbucket webhooks (HTTPS).
-
Validate and unwrap the Bitbucket event envelope.
-
Forward or transform the
resourceSpansinto your OTel collector or vendor’s ingest API. -
Model your views/dashboards around:
-
bbc.pipeline_runfor high‑level SLO/SLA views -
bbc.stepfor per‑stage performance -
bbc.commandfor deep debugging -
bbc.step.containerattributes for resource profiling
-
Depending on your stack you may either:
-
Directly parse and forward the JSON as OTel traces, or
-
Map attributes into your vendor’s trace/span schema
Putting it together: typical use cases
Once wired up, teams commonly use pipeline traces for:
-
Performance bottlenecks:
-
Find slowest steps and commands by
step.duration_in_secondsandcommand.duration_in_seconds
-
-
Reliability and flakiness:
-
Correlate failed runs with specific commands or steps (
step.state.result.name,pipeline.state.result.name)
-
-
Capacity planning:
-
Use
container.metrics.cpu.*andcontainer.metrics.memory.*to understand resource needs per pipeline
-
-
Cross‑system correlation:
-
Join pipeline run traces with application rollout traces using shared attributes (e.g. build number, commit, or branch)
-
What better visibility means in practice
When pipeline activity shows up as OpenTelemetry traces, different teams get the slice of visibility they care about most:
-
Developers can see exactly which steps and commands are slowing them down.
-
SREs and platform engineers can reason about pipeline capacity with real CPU/memory data instead of guesswork.
-
Release and reliability owners can correlate deploy pipelines with application behavior in the same trace views they already trust.
The result is a shared, data‑driven picture of your delivery system, where conversations move from “I think the pipeline is slow” to “we know which part is slow, why, and what it’s costing us.”
Try setting up pipeline traces today, and let us know what you think!
Want to learn more? Check out the docs.
Was this helpful?
Thanks!
Dan Hom

3 comments