Community resources
Community resources
Community resources
Built a Forge app that turns plain-text questions into Jira charts (no JQL) — would love feedback
Hey all — sharing an app I built, curious what people think.
I kept watching people avoid Jira's built-in reporting because writing JQL felt like a chore for a one-off question — "how many bugs are overdue by assignee" shouldn't require knowing filter syntax.
So AI Reports for Jira and Confluence does the JQL step for you: type the question in plain text, it translates it to JQL using Claude via Atlassian's own @Forge/llm (no external API key, no third-party AI gateway — data never leaves Atlassian's infrastructure), runs it against your real issues, and picks a chart type automatically (bar/line/pie/KPI/table/pivot).
A few examples that work well as a starting point:
- "Open bugs by priority in PROJ" → bar chart
- "Issues closed per week over the last 3 months" → line chart
- "What's assigned to me and overdue?" → sortable table
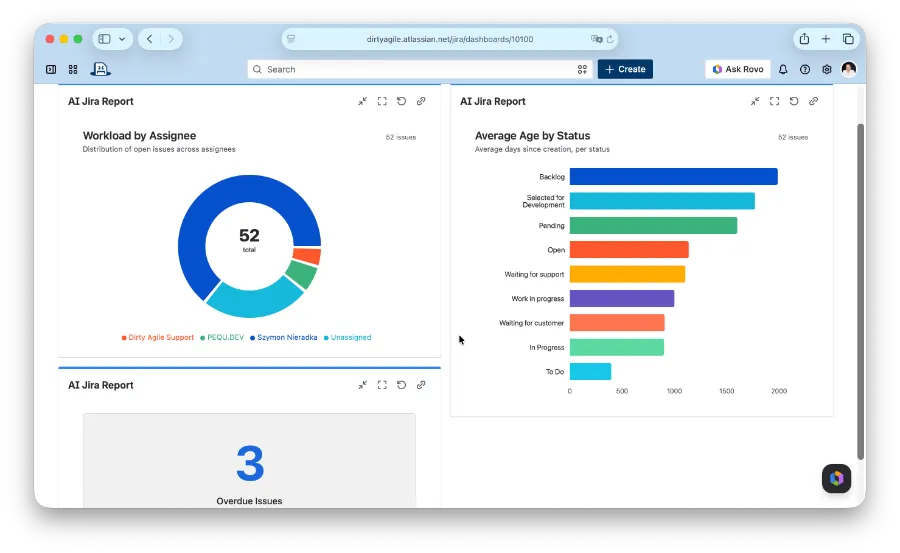
The generated JQL is always shown before the chart renders, so you can sanity-check or tweak it — it's not a black box, and it's not summarizing/guessing: same permissions, same underlying issue data as a manual search.
Once a question is useful, you can save it and drop it in two places: a Jira dashboard gadget or a Confluence macro — both re-run the JQL live on each view (no AI cost on the re-run, only the first ask does).
It's a paid Forge app — disclosure, I'm the developer. Genuinely interested in hearing if this matches how people actually want to explore Jira data, or if there's a use case it's missing — still early (few installs, still shaping the roadmap for a Confluence-side view too).
Best,
SN