The team’s cycle time is increasing.
Leadership wants to know why.
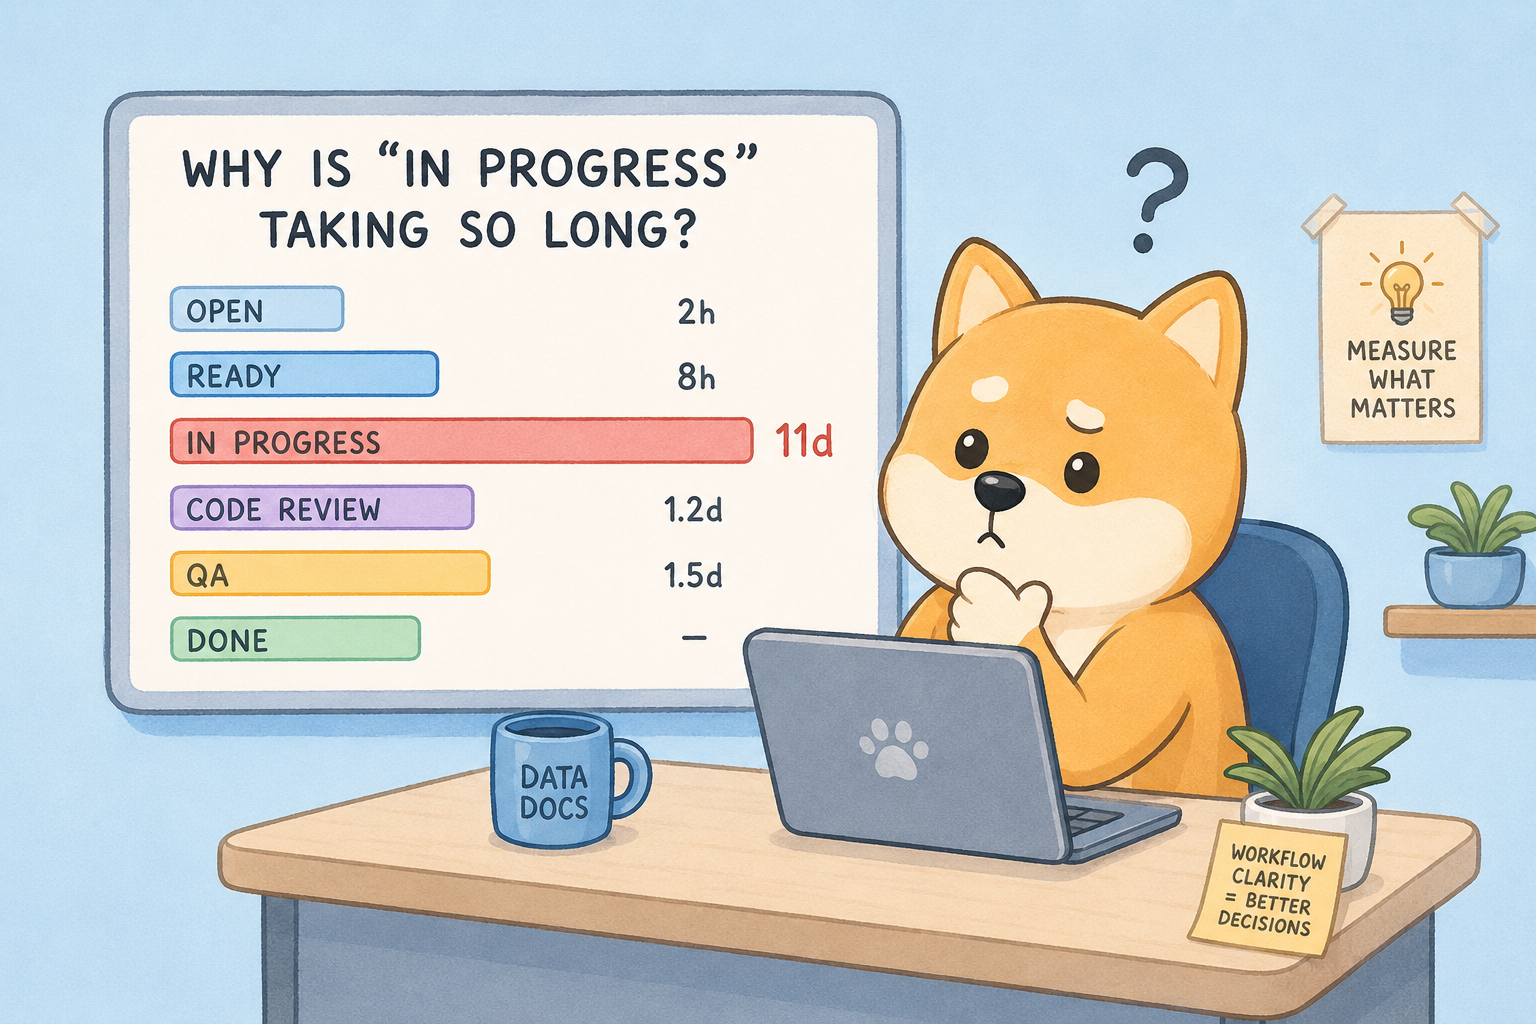
You open your Jira reports, and most of the time appears to be accumulating in one status: In Progress.
So naturally, everyone reaches the same conclusion: Development is the bottleneck.
Developers must be taking too long. Perhaps the team needs better estimates, more capacity, stricter deadlines, or another engineer. Except development may not be the bottleneck at all.
The real problem may be that In Progress has quietly become a catch-all status. It no longer means that someone is actively working on an issue. Instead, it has become the default place for every situation that does not fit neatly anywhere else.
Once that happens, your workflow may still look simple, but your reports stop describing reality.
What Is a Catch-All Status?
A catch-all status is a Jira workflow status that represents several different real-world situations at the same time.
It is usually called something broad, such as:
- In Progress
- Working
- Active
- Ongoing
- Processing
The name itself is not necessarily a problem. The problem is that nobody has agreed on what the status actually means.
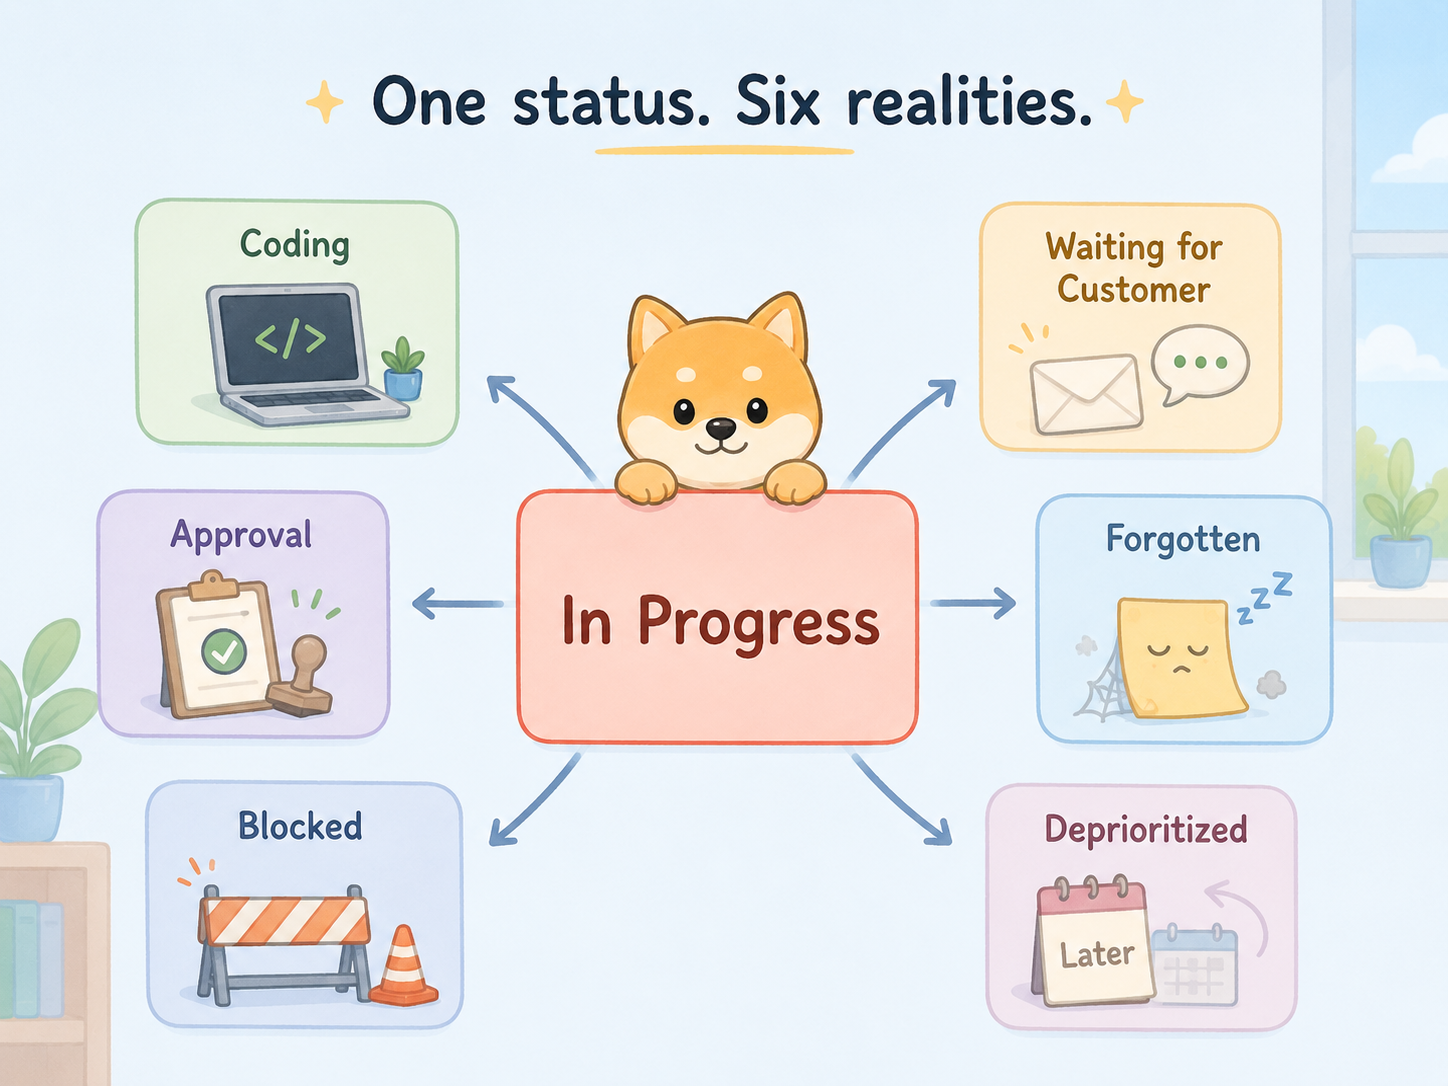
A ticket marked as In Progress may be:
- actively being developed;
- waiting for a customer response;
- blocked by another team;
- waiting for approval;
- forgotten;
- deprioritized.
Yet every situation uses the same status: In Progress.
The workflow says one thing. Reality says six different things.
This creates ambiguity, and ambiguity destroys metrics. Someone looking at an individual Jira issue may understand the context from comments, Slack conversations, stand-ups, or memory. A report does not.
It only sees that the issue remained in In Progress for eleven days. It cannot tell whether that period included eleven days of development, two days of development and nine days of waiting, one hour of work followed by a forgotten ticket, or a blocker that nobody recorded in the workflow.
The report can calculate Jira history accurately. It cannot restore distinctions that the workflow never recorded.
How to Spot One in Under Two Minutes
A catch-all status often reveals itself in the data before anyone notices the workflow problem.
One of the fastest ways to identify it is to open the Average Time report in Time in Status by SaaSJet and compare how long issues remain in each status on average.
Step 1: Open the Average Time report
Select the relevant project, sprint, team, or JQL scope.
Use a reporting period that includes enough completed or recently active issues to show a meaningful pattern.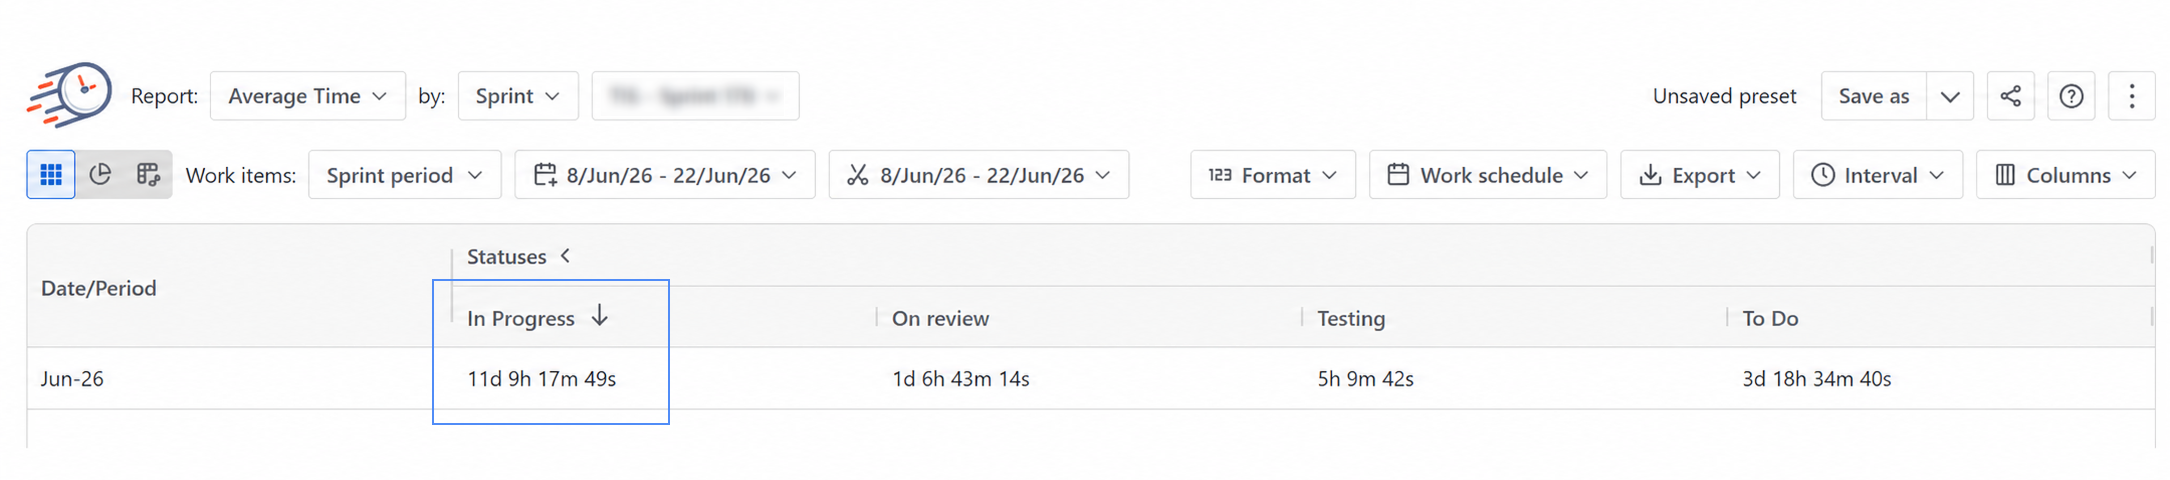
Average Time report showing In Progress sits at 11+ days, roughly 3× the neighboring statuses.
Step 2: Compare statuses by average duration
Look at the statuses with the highest average values first.
You may see something like this:
|
Status
|
Average time
|
|
Open
|
2 hours
|
|
Ready
|
8 hours
|
|
In Progress
|
11 days
|
|
Code Review
|
1.2 days
|
|
QA
|
1.5 days
|
|
Done
|
—
|
Now ask a simple question: Why is one status dramatically larger than every other step?
Maybe the work performed during that stage is genuinely more complex. Development will often take longer than opening, triage, or review, so a larger number is not automatic proof of a workflow problem. But when one status is dramatically higher than everything around it, investigate what is actually happening inside it.
Are issues being actively worked on for the entire period, or are they also waiting for customers, waiting for approvals, blocked by dependencies, paused, deprioritized, or sitting untouched?
When one status takes three or four times longer than every neighboring status, you are probably not looking at a bottleneck. You are looking at a catch-all.
The three-to-four-times difference is not a universal mathematical rule. Think of it as a diagnostic signal. It tells you where to investigate first.
Open several issues with the longest durations. Review their comments, status histories, assignee changes, and blockers. You may quickly discover that In Progress is not one workflow stage.
It is a waiting room for everything the workflow does not describe properly.
Why It Breaks More Than One Metric
A catch-all status distorts nearly every metric built on top of your Jira workflow.
Cycle Time
Cycle Time is commonly used to represent how long work takes after the team begins actively working on it. But what happens when In Progress includes both active development and waiting?
Imagine that a developer works on an issue for two days. The team then waits six days for a customer response, but the issue remains in In Progress for the entire period.
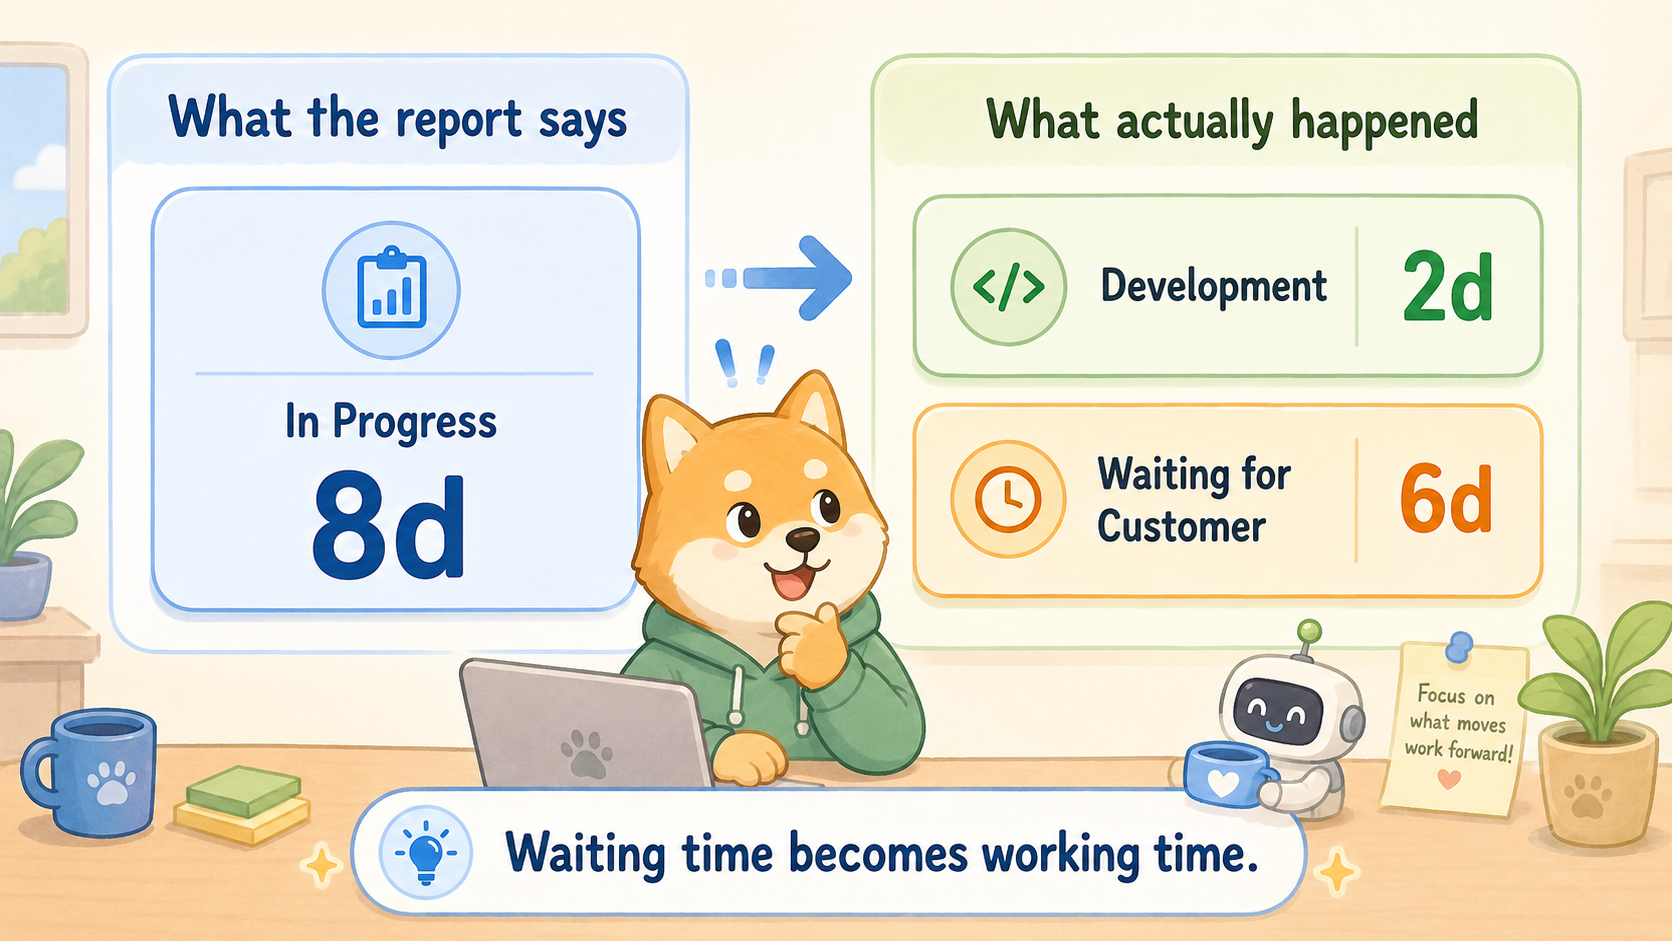
The report records eight days of “work,” although only two days were active development. Waiting time has quietly become working time. As a result, Cycle Time appears higher even though the development process itself may be functioning normally.
Lead Time
Lead Time measures the broader time required to move work through the delivery process. A catch-all makes that duration difficult to explain because engineering capacity, customer dependencies, approvals, unclear requirements, blockers, and deprioritization are mixed together.
The total elapsed duration may be technically accurate, but the organization cannot see why it was long. When all these situations are recorded as In Progress, Lead Time becomes a number without a useful explanation.
Bottleneck Analysis
Bottleneck analysis should identify the workflow stage that restricts delivery. A catch-all sends the team in the wrong direction: the report shows a large In Progress value, so the organization starts optimizing development, even though the real delay may be slow customer responses, approvals, cross-team dependencies, unclear requirements, or poor ticket hygiene.
The real bottleneck becomes invisible inside a status that means six different things simultaneously.
Throughput Forecasting
Forecasting depends on historical data being reasonably consistent. If previous issues spent an average of eleven days in In Progress, the team may use that value to estimate future delivery.
But one issue may include eleven days of development, another may include two days of development and nine days of waiting, and a third may have been forgotten for a week. These are not comparable observations. When they are treated as one category, historical data becomes noisy and future forecasts become less reliable.
Assignee Time
A catch-all can also distort assignee-based reporting. Issues often remain assigned to developers while waiting for customer feedback, product decisions, another team, approval, access, or infrastructure changes.
An Assignee Time report may therefore show that a developer held an issue for ten days. That does not necessarily mean the developer spent ten days actively working on it; the issue may have remained under the developer’s name while no work could be performed.
This can make developers appear overloaded or slow and can make workload distribution look uneven. The report is correctly reflecting assignment history. The workflow is failing to distinguish active responsibility from waiting.
The Hidden Cost Nobody Notices
The most expensive consequence of a catch-all status is not an inaccurate report. It is the decision someone makes because of that report.
Imagine a team reviews the following results:
- Code Review: 1.2 days
- QA: 1.5 days
- In Progress: 11 days
The conclusion seems obvious:
- Code review is fine.
- QA is fine.
- Development is too slow.
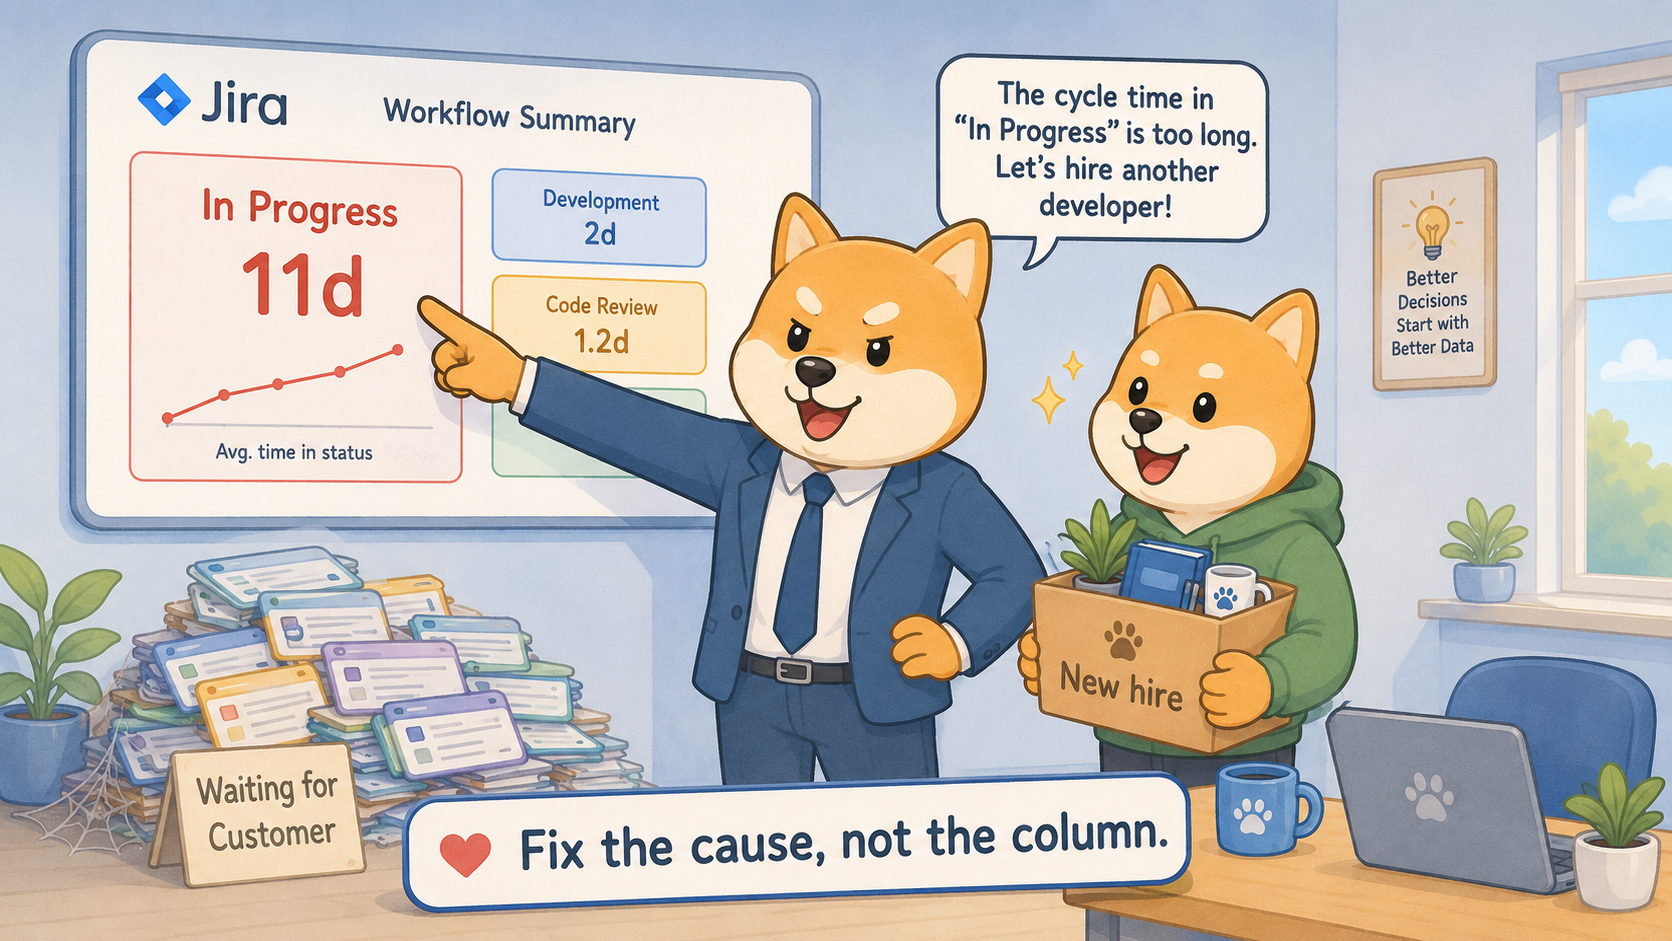
The company decides to hire another developer. The new employee is onboarded. Management expects Cycle Time to improve.
When the team finally investigates the issues inside In Progress, it discovers that 40% of the recorded time was spent waiting for customer feedback. The organization invested money in increasing development capacity even though capacity was not the primary problem. The real issue was an external waiting stage that the workflow failed to record.
The company spent money fixing the wrong problem.
The same pattern can lead organizations to pressure developers, introduce individual performance targets, shorten estimates without changing the process, add meetings, reorganize teams, purchase tools, or change staffing levels. None of these actions will solve a delay caused by customer responses, approvals, or dependencies.
Bad workflow definitions lead to bad data. Bad data leads to bad management decisions.
How to Fix It
The fix is not turning your workflow into 20 micro-statuses—that creates a different reporting mess and a workflow nobody wants to update honestly. The goal is meaningful separation: distinguish the situations that are genuinely different, frequent, and important for ownership or reporting.
Instead of one catch-all status such as In Progress, use meaningful distinctions such as:
- Development
- Waiting for Customer
- Waiting for Approval
- Blocked
These are alternatives, not a mandatory sequence. Each has a different owner, expected duration, and action required to move the work forward—which is exactly why combining them destroys the signal.
Pair the workflow with a clear team agreement: a one-line definition of what In Progress means, when an issue should enter it, when it should leave, who is responsible for moving it, and how stale issues are reviewed.
If changing the workflow is difficult, begin with a shared definition and a regular audit of long-running In Progress issues. Status Groups become useful once the workflow already contains meaningful statuses that can be combined into broader Working and Waiting categories. They cannot split one ambiguous status into active and waiting time after the fact.
How Time in Status Helps
Time in Status does not decide how your workflow should be designed.
Its role is diagnostic: it helps reveal when the workflow recorded in Jira no longer matches the way work actually happens.
Average Time Report
The Average Time Report is the main diagnostic tool for this problem.
Use it to:
- select a team, project, sprint, or JQL scope;
- review the average duration of each status;
- sort descending and identify the unusually large value;
- inspect the issues behind it.
The report does not prove that a large status is a catch-all. It shows where to ask better questions.
If In Progress is eleven days while Development Review and QA are approximately one day each, open the underlying issues and determine what those eleven days actually contained.
Status Groups
Status Groups help convert detailed workflow data into meaningful categories.
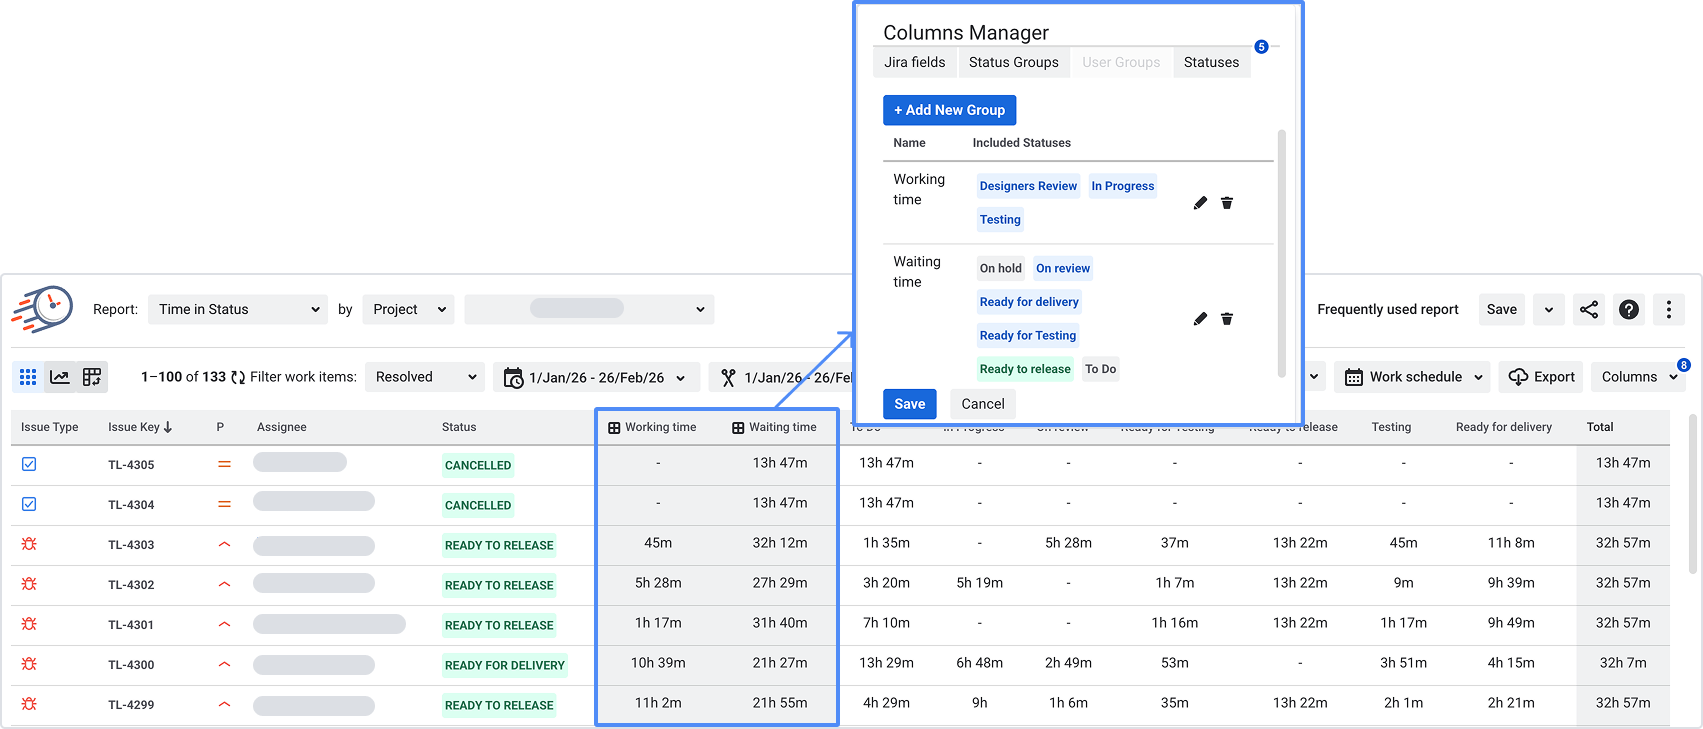
Status Groups configuration showing Working and Waiting groups.
For example:
Working
Waiting
- Waiting for Customer
- Waiting for Approval
- Blocked
Once the statuses are clearly defined, these groups help teams compare active work with waiting, break down Cycle Time, and compare process stages across teams or periods. But without clear source statuses, the comparison becomes meaningless.
The reporting configuration cannot solve ambiguity that already exists in the workflow.
Report Summary
The Report Summary provides a higher-level view of report results, including values such as:
- average durations;
- total durations;
- issue counts;
- comparisons across statuses or selected periods.
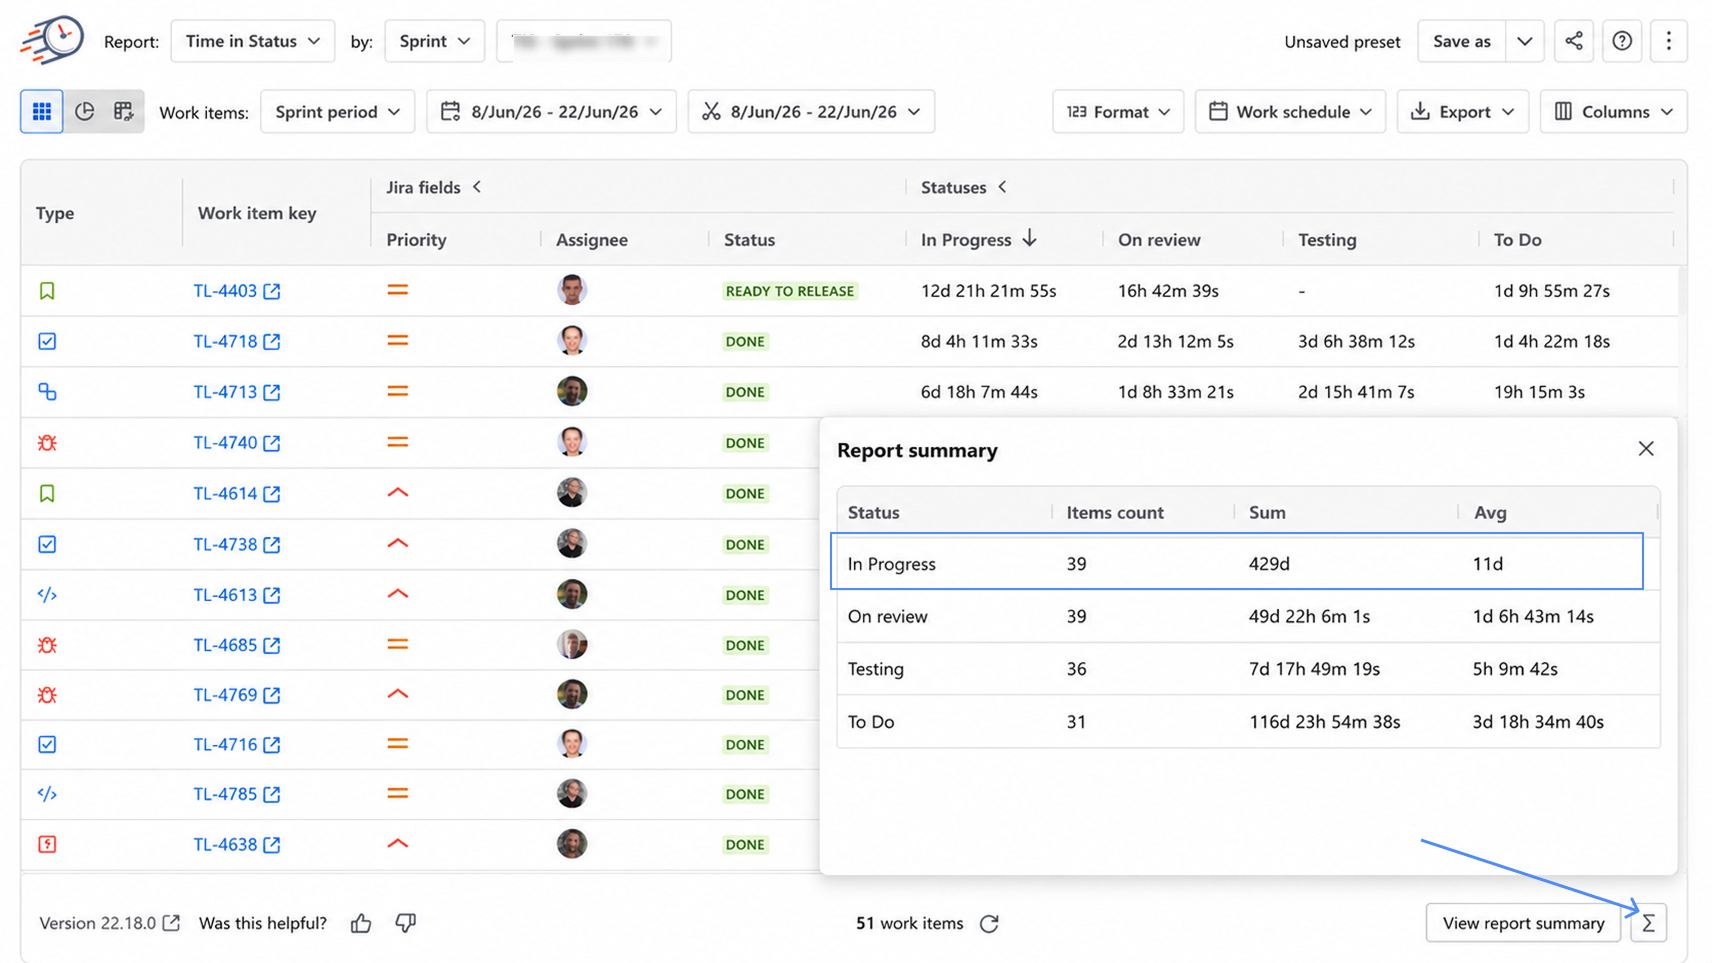
Report Summary with the In Progress average clearly higher than the surrounding statuses.
This helps determine whether the problem is widespread or caused by a few extreme issues.
For example:
- If many issues spend approximately ten days in In Progress, the problem may be systemic.
- If most issues spend two days there but two forgotten issues remained for several months, the average may be distorted by outliers.
Both situations require attention, but they require different responses.
Filtering
Sometimes the catch-all exists only in one part of the organization. One team may use In Progress correctly while another uses it for development, blockers, waiting, and paused work.
Filtering by project, sprint, issue type, team, assignee, label, JQL query, or reporting period helps isolate the pattern. A local workflow issue should not automatically be treated as a company-wide performance problem.
Time in Assignee Report
The Time in Assignee report is an underrated angle. Because this report tracks how long a work item stays assigned to a person (not just how long it sits in a status), it will show inflated numbers for whoever "owns" catch-all tickets — even on days they've done zero work on them. If someone's Assignee Time looks unusually high relative to their actual output, the catch-all status is very often why.
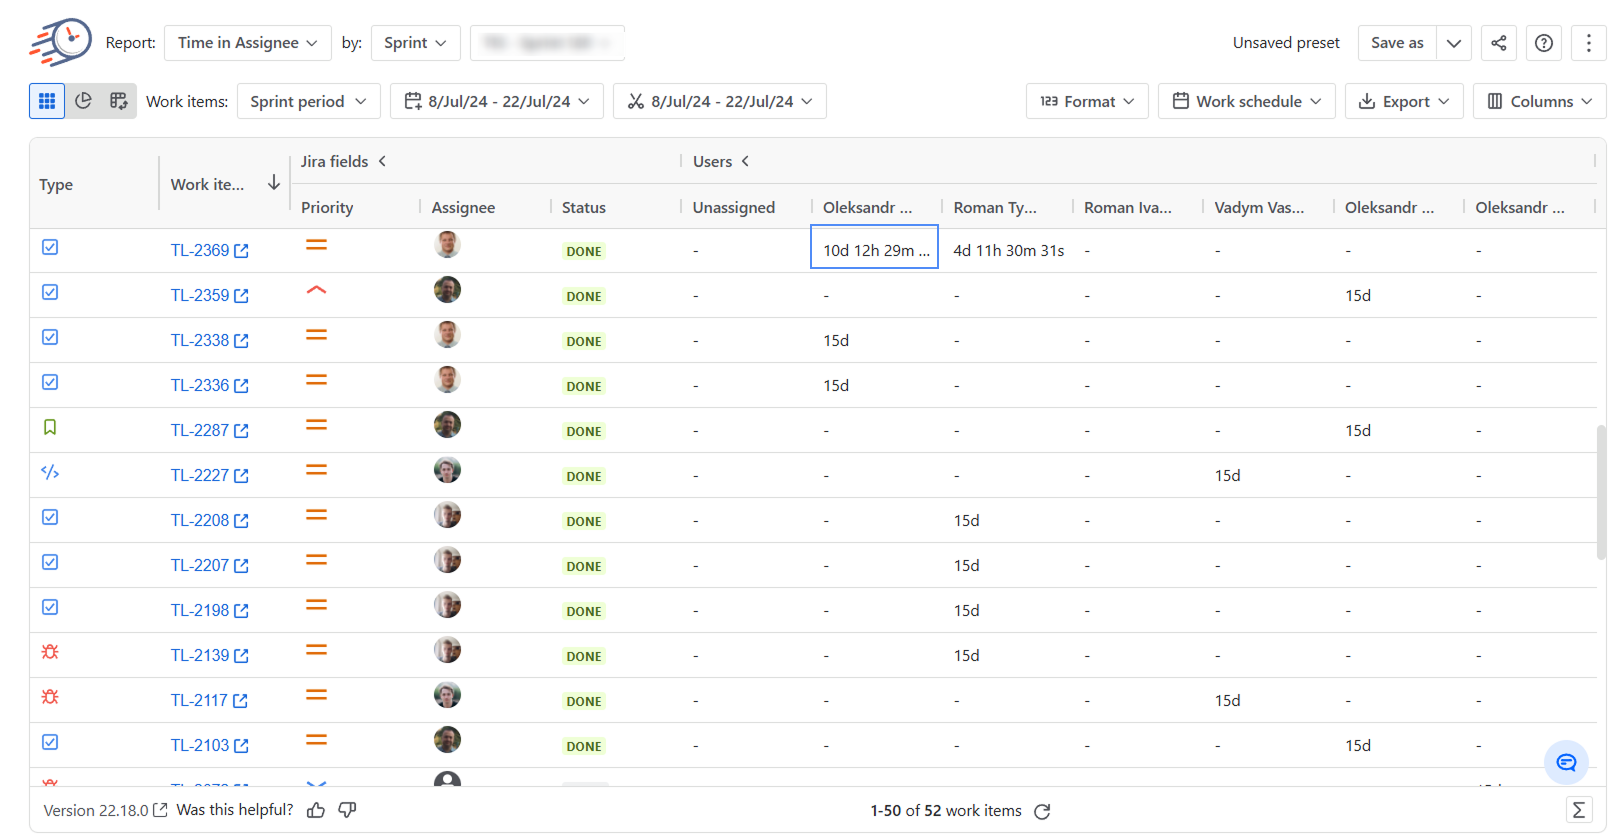
Before-and-after comparisons
The clearest way to demonstrate the value of workflow cleanup is to compare the data before and after the change.
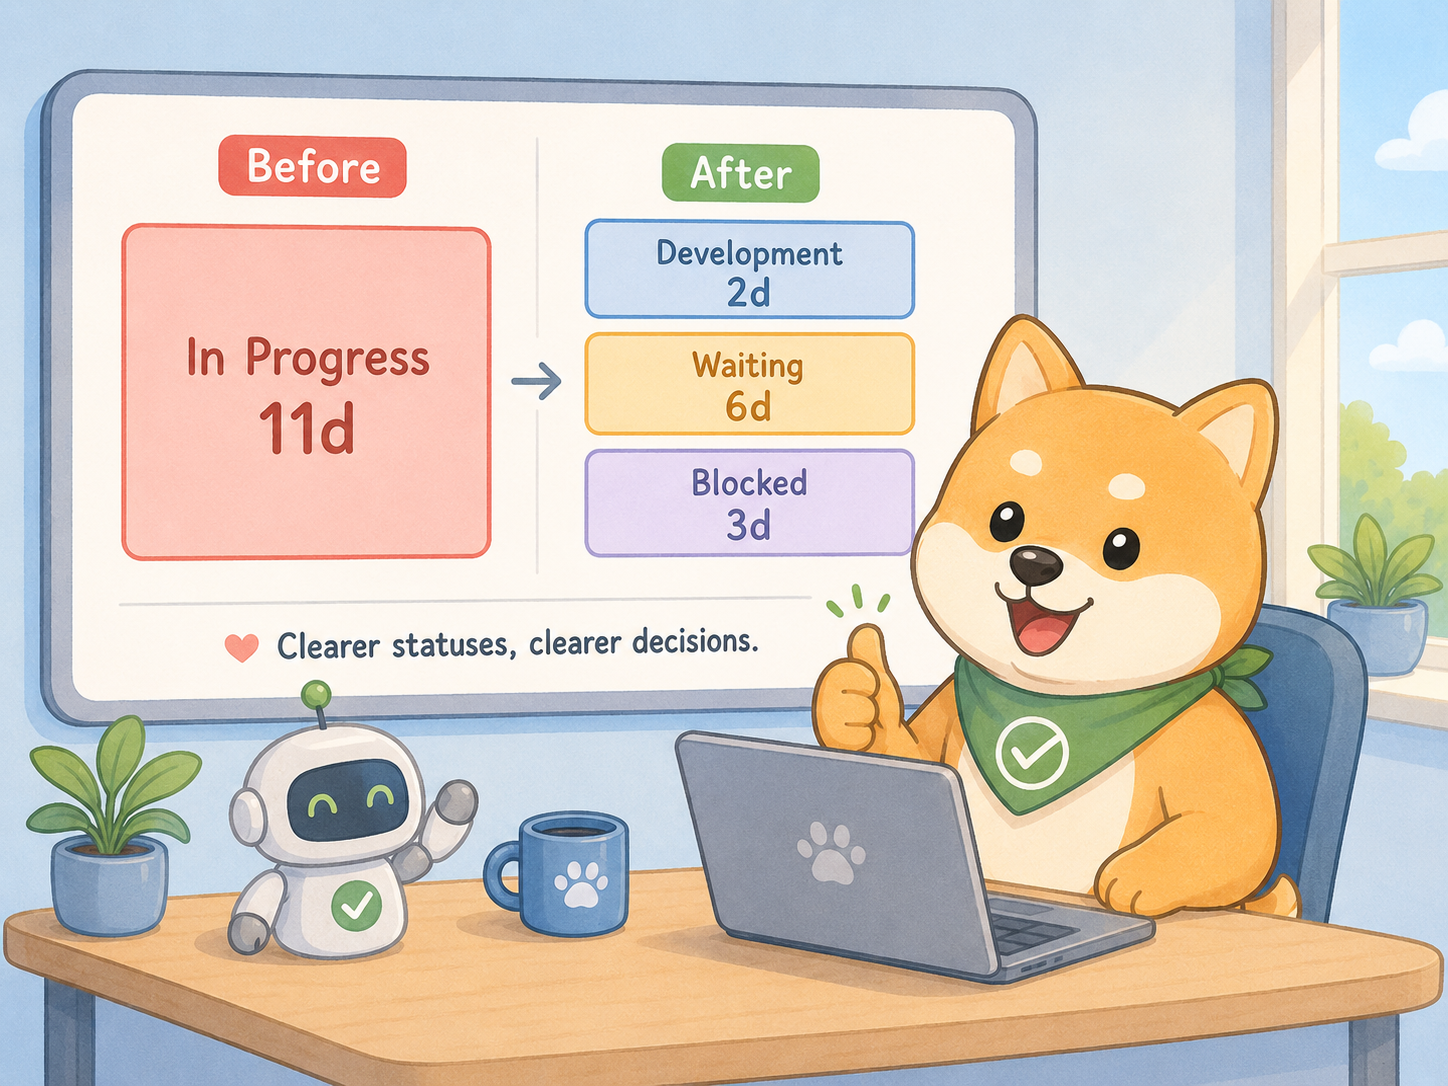
The total time may not have changed yet, but suddenly everyone understands what is actually happening. Development is not the primary delay: customer waiting is the largest contributor, while blocked work also plays a role.
The organization can now respond to the real problem instead of optimizing the wrong stage. Future comparisons also become meaningful: if Development decreases, the team knows active work improved; if Waiting for Customer remains high, the external dependency still needs attention.
Conclusion
If one status in your workflow is dramatically larger than everything around it, do not immediately assume it is your bottleneck.
First ask a simpler question:
Does this status represent one thing—or does it represent everything?
Open the Average Time report.
Find the unusually large status.
Inspect the issues behind it.
Compare Status Groups, Report Summary data, filtered teams, and Assignee Time results.
The answer may explain why your metrics have never quite felt right.
