Community resources
Community resources
Community resources
How to Use ProScheduler Gantt Charts as a Native Jira Feature?
🎄 Merry Christmas, Atlassian Community! 🎄
I’m Asia from the TeamBoard team 👋
As the year wraps up, many Jira teams reflect on what worked well—and where planning became more challenging as projects grew more complex.
In this post, we’ll share how Jira can support visual project planning with Gantt charts, and explore options for making this feel more native to Jira workflows.
---
Jira excels at tracking issues and supporting Agile execution, but when it comes to visual project planning, teams often need more than boards and backlogs can provide.
This leads many teams to ask a simple question:
Does Jira have a Gantt chart?
The short answer is NO. Jira doesn’t offer native Gantt charts, so teams rely on plugins to visualize timelines, dependencies, and milestones.
That’s where TeamBoard ProScheduler comes in. ProScheduler adds a fully interactive Gantt chart directly on top of Jira issues, keeping dates, links, and sync progress.
With the right plugin, Jira can become a powerful planning tool without exporting data or switching platforms.
Limitations of Creating a Gantt Chart in Jira
Jira is widely used for Agile work and issue tracking, but as projects become larger and more complex, its planning limitations quickly surface:
No Native Gantt Chart
Jira does not include built-in Gantt chart functionality. There is no native way to visualize timelines, dependencies, milestones, and task sequencing in a single, connected view. Teams must rely on workarounds or plugins to gain basic timeline visibility.
Limited Big-Picture Visibility
Jira boards and backlogs are designed for execution, not planning. They show what is being worked on, but not when work starts, finishes, or how tasks relate over time. This makes it difficult to understand overall project flow or assess the impact of delays.
Cumbersome Resource Planning
Jira reporting focuses primarily on individual users or single teams. Gaining a clear view of team-wide capacity, cross-team workloads, or overlapping assignments requires manual analysis. This often results in hidden over-allocation and late discovery of bottlenecks.
Manual and Fragile Scheduling
Updating task dates in Jira rarely triggers automatic adjustments to related issues. Dependencies are not treated as scheduling logic, so project managers must manually reschedule downstream work whenever plans change—an error-prone process for larger projects.
Basic timeline reporting
Jira lacks advanced planning insights such as critical path analysis, baseline comparisons, or a unified view of total team workload.
How ProScheduler Makes Gantt Charts Feel Native to Jira
With TeamBoard ProScheduler, the Gantt chart is not just a visual timeline; it’s directly connected to Jira’s core project data. Planning, tracking, and execution all stay aligned in one place.
Build Your Timeline with Real Jira Dates
Date Mapping allows you to keep task dates synchronized between Jira and TeamBoard ProScheduler. Any date change made in one system is automatically reflected in the other—so there’s no need for manual updates or duplicated schedules.
For example:
- When developers update Start or Due dates in Jira, those changes immediately appear on the Gantt chart in ProScheduler.
- When project managers adjust task dates directly on the Gantt chart, the updated dates are written back to Jira and visible on Jira boards.
How to Set Up Date Mapping

- Select existing Jira date fields: Choose the fields your team already uses, such as Start Date and Due Date.
- Map them to the Gantt chart: These Jira fields become the start and end dates of tasks on the Gantt timeline.
- Choose how to align existing schedules: When enabling Date Mapping, decide how current data should be handled:
- Follow Jira dates – Use this if your project is already scheduled in Jira and you want the Gantt chart to reflect those dates.

- Migrate Gantt dates to Jira – Choose this if planning started in ProScheduler and you want those planned dates written back to Jira.

Flexible Work Breakdown Structure (WBS)
In standard Jira, work hierarchies are tied to issue types (Epic → Story → Task). ProScheduler removes this rigidity by letting you restructure work visually, without breaking Jira data.
.jpg")
Here’s how it works:
-
Reorder work using drag and drop: Drag and drop issues in the WBS to change their sequence on the Gantt chart. This helps reflect execution order, phases, or priorities instead of backlog order.
-
Jira Alignment: While restructuring the WBS, the tool keeps the original Jira data intact and respects current Jira hierarchies, allowing for a shift from a backlog-oriented structure to a planning-oriented one without breaking existing relationships.
Sync Task Progress from Jira
Keeping task progress aligned between Jira and the Gantt chart is essential for accurate project tracking. TeamBoard ProScheduler supports two flexible ways to synchronize progress, so teams can choose the approach that best matches how they work.
Option 1: Manual Progress Using a Jira Number Field
Some teams don’t use time tracking and prefer to estimate progress manually. In this case, ProScheduler can use a Jira Number field (0–100) to represent percent complete.

Once this field is connected in Progress Settings, progress becomes easy to update:
-
Team members can enter a value directly in Jira

-
Project managers can update progress either by dragging the progress bar directly on the Gantt chart or by entering a value in the Progress field in TeamBoard.

→ Both actions stay synchronized, so Jira and the Gantt chart always show the same progress.
This option works well for teams that measure progress based on milestones, deliverables, or subjective completion rather than hours spent.
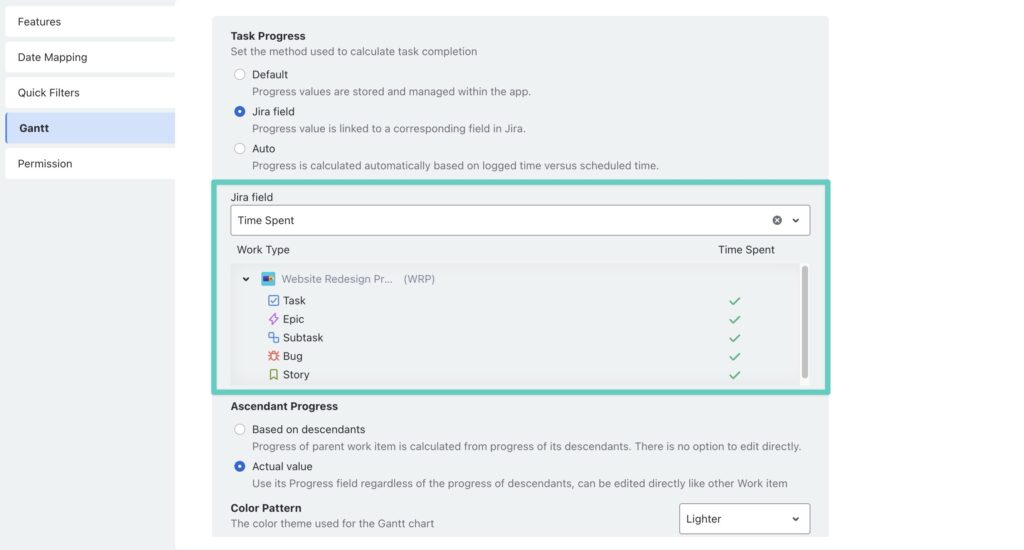
Option 2: Automatic Progress from Jira Time Tracking
For teams that already log time in Jira, ProScheduler can calculate progress automatically using Time Spent and Remaining Estimate. After selecting Time Tracking (Spent) in Progress Settings, the Gantt chart updates itself as work is logged.
Turn Jira Issue Links into Visual Dependencies
Seeing how tasks are connected is just as important as seeing when they happen. ProScheduler lets you turn Jira issue links into clear visual connections on the Gantt Chart, so task relationships are easy to understand at a glance.
How to Visualize Jira Dependencies
Step 1: Create or review dependencies in Jira
In Jira, make sure your issues are linked using dependency relationships such as “blocks” or “is blocked by.” ProScheduler uses these existing links, so there’s no need to recreate dependencies in the app.
Step 2: Open Gantt settings in ProScheduler
In the Gantt settings, you can configure how Jira issue links are mapped and displayed as dependencies on the Gantt chart. ProScheduler supports four dependency types:

- Finish-to-Start (FS): A task cannot start until another task has finished.
- Start-to-Start (SS): A task cannot start until another task has started.
- Finish-to-Finish (FF): A task cannot finish until another task has finished.
- Start-to-Finish (SF): A task cannot finish until another task has started.
Once enabled, these dependency links stay synchronized with Jira and are shown directly on the Gantt chart for easy review.
Step 3: View dependencies on the Gantt chart
Open the Gantt chart. ProScheduler will automatically map Jira issue links and display them as connection lines between tasks on the timeline.


Whether you create or update a dependency in Jira or directly in ProScheduler, the link stays synchronized—so task relationships are always reflected consistently in both tools.
Group Jira Issues Directly on the Gantt Chart
Beyond timelines and dependencies, TeamBoard ProScheduler also lets you group issues on the Gantt chart using Jira fields. This functionality allows teams to manage complex projects more efficiently by providing flexible, visual control over their Jira data within the Gantt chart.

You can group tasks on the Gantt chart by:
- Status – See how work is distributed across To Do, In Progress, and Done
- Assignee – Instantly understand who is responsible for what and spot workload imbalance
- Work Type / Issue Type – Group Epics, Stories, Tasks, or custom work types
- Priority – Highlight high-priority work across the timeline
- Fix Version – Organize tasks by release or delivery version
- Sprint – Visualize sprint scope and timelines directly on the Gantt chart
Advanced Gantt Features Inside Jira
ProScheduler enhances Jira with advanced Gantt chart features, transforming static timelines into dynamic, automated project plans:
Key Features of ProScheduler in Jira:
-
Auto-Scheduling: When a task is moved, ProScheduler automatically shifts all dependent tasks, ensuring the project timeline remains realistic and consistent.
-
Critical Path Analysis: The tool highlights the chain of tasks that directly impact the project’s completion date.
-
Baselines (Plan vs. Actual): Users can capture a snapshot of the original project plan at any point, such as during kickoff, to compare against actual progress.
-
Resource Heatmap: This feature updates instantly as tasks are adjusted, highlighting workload imbalances, over-allocation, and underutilization. This allows for immediate rebalancing of work to prevent issues.
Conclusion
Jira may not include native Gantt charts—but with TeamBoard ProScheduler, you don’t just add a visualization layer. You get a fully synchronized planning system that uses Jira’s own data, rules, and workflows.
Dates, dependencies, progress, and resources all stay aligned across Jira and the Gantt chart—so teams can plan visually without leaving Jira behind.
If you want Jira to show not just what your team is working on, but when, how, and why it matters, ProScheduler makes Gantt charts feel like a natural part of Jira.
Was this helpful?
Thanks!
Asia Pham

0 comments