Community resources
Community resources
Community resources
- Community
- Products
- Jira Service Management
- Questions
- Jira Service Desk Cloud Report - Request Type Report Gadget Dashboard
Jira Service Desk Cloud Report - Request Type Report Gadget Dashboard
Hi,
I saw only 2 reports type available in Jira service desk. I wanted to customize to include request type as the dashboard report gadget, is there anyway to do this? We are using both cloud Jira software and Jira service desk.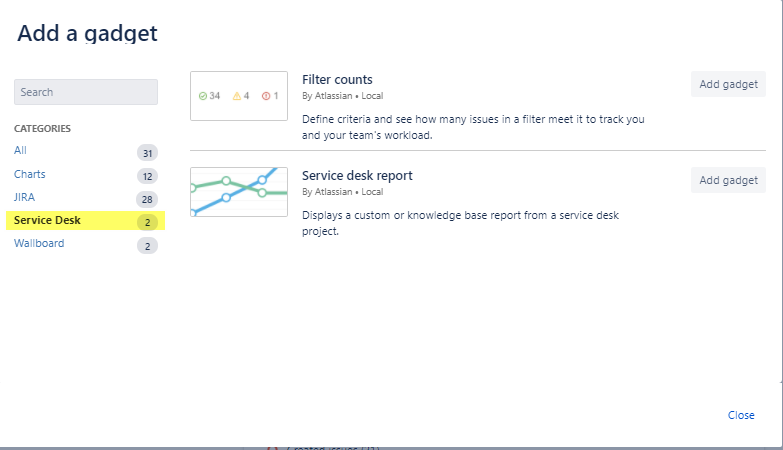
5 answers
1 accepted

Hi Angeline,
What output do you want to see with Request Type? You might be able to get what you need with one of those 2 gadgets.
Carolyn
Hi Carolyn,
Total request type created group by request type. I tried to use JQL =request type="A" but it show invalid syntax. I also tried with =customer request type="A" which I found from the online documentation guide but both show wrong syntax,
I tried both gadget but not working. Thanks
You must be a registered user to add a comment. If you've already registered, sign in. Otherwise, register and sign in.

It sounds like it might be a problem with the JQL syntax. When in doubt and it's simple, stick to basic JQL.
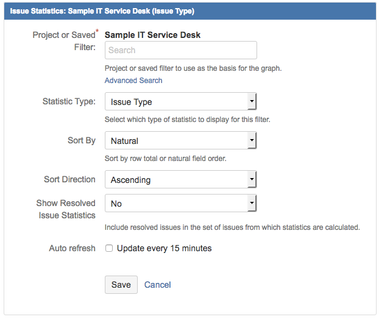
Now that I re-read your question, you should be able to use the regular Jira gadget called Issue Statistics (just input your project or a filter with multiple projects) and pick Statistic Type: Issue Type, and it will show you a summary count.
If you really would like to specifically use those 2 gadgets (the output looks different so that could be fun), here are some other ideas:
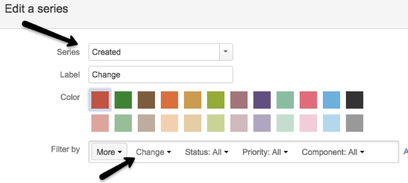
You can create a custom report called "Number of Requests per Type". Within that report, create a "Series" for each of your request types using Basic JQL in the "Filter by" section.
Once you've created this custom report, you can reference it in the gadget "Service Desk Report."
Alternatively, you can create a new filter for each request type that you have. For each new filter you create, just use the Basic JQL to select the Service Desk project(s) and Issue Type. Then input each of those filters into a new "Filter Counts" dashboard gadget.
Hope this helps,
Carolyn
You must be a registered user to add a comment. If you've already registered, sign in. Otherwise, register and sign in.
Hi Carolyn,
Thanks for the suggestion however I think you might still get my question wrong. I am looking for request type filter and not issue type. I have no issue running a issue type report. But not "request type". As far as I understand, both are different thing. The request type are not available as part of the statistic type selection.
Also, wonder why my series version looks so different from yours? Could you please advise? Thanks
You must be a registered user to add a comment. If you've already registered, sign in. Otherwise, register and sign in.

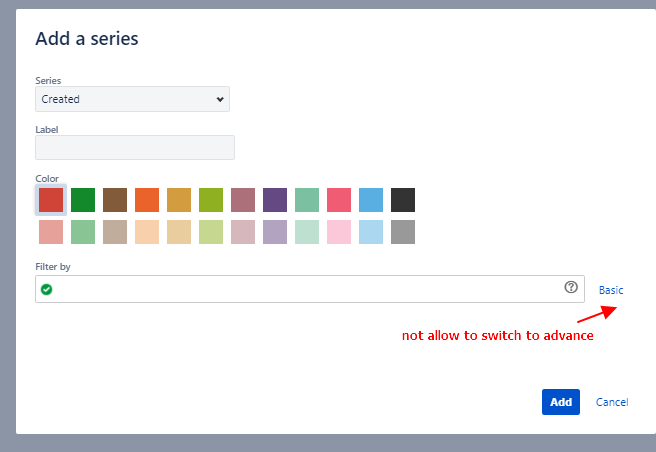
Your Series screen will not let you click on "Basic to switch to "Basic"? If that's the case, what happens when you click on "Basic"? It looks like you are currently in Advanced mode (typing out your filter). The "Basic" link is just a toggle more or less.
You're right- I defaulted to Issue Type filters in my answers. Sorry about that.
In Cloud, I'm not able to reproduce your problem with building the JQL filter (although this one you do need to do in Advanced since the "Request Type" field doesn't exist in Basic. Can you do a screenshot of what you have that is failing?
Here's what I have. The filter I'm building gives suggestions for Request Types (that is the cursor in between the two quotes):
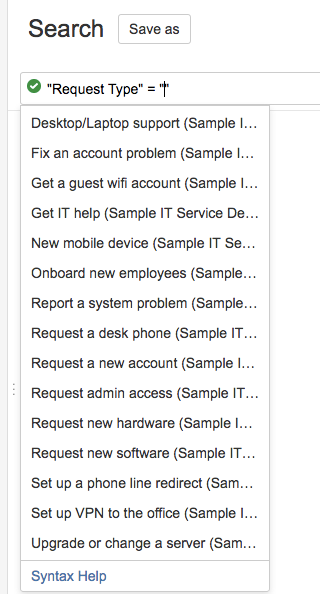
You must be a registered user to add a comment. If you've already registered, sign in. Otherwise, register and sign in.
Hi again,
Here's the warning message I got when try to switch to basic.
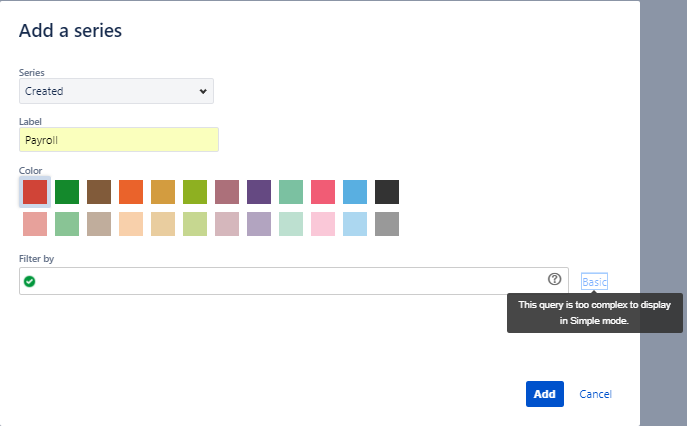
Thank you so much!
You must be a registered user to add a comment. If you've already registered, sign in. Otherwise, register and sign in.

No idea what would cause that bizarre error message for you :(
Glad I could help with the JQL!
Carolyn
You must be a registered user to add a comment. If you've already registered, sign in. Otherwise, register and sign in.
I have provided a workaround below. Could you please review it and let me know if you find it helpful?
https://confluence.atlassian.com/pages/viewpage.action?pageId=1369277804
You must be a registered user to add a comment. If you've already registered, sign in. Otherwise, register and sign in.
Is there any plan to add the ability to build dashboard gadgets based on Service Desk Request Types? Many times, sorting the data only by Issue Type is not enough since multiple Request Types can be connected to one Issue Type. If searching based on the Request Type field is working, why can't we use it on our dashboard without installing plugins? Is there any existing JIRA request for that (I would love to create one if not)?
You must be a registered user to add a comment. If you've already registered, sign in. Otherwise, register and sign in.

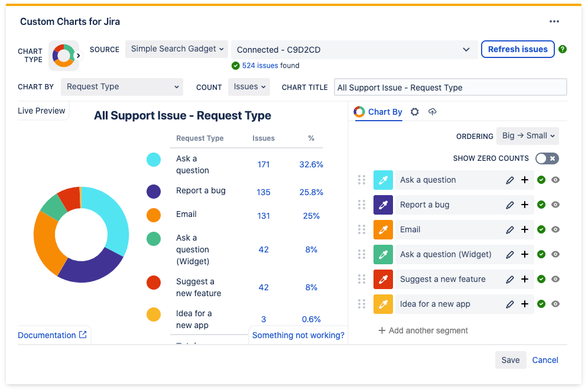
If you're looking for an easy solution to this problem our app Custom Charts for Jira allows you to select Request Type as a statistic. You can also select the colors, rename and group Request Types together directly in the chart editor, with zero coding required.
You can check the app out right now on our interactive app playground.
I hope that helps anyone who is also looking for an answer to this question 🙂
Tom - Custom Charts Product Manager
You must be a registered user to add a comment. If you've already registered, sign in. Otherwise, register and sign in.
You can use VisualScript for Jira to report off of the Request Type field in your Jira dashboard gadgets.
You can report off of many different chart types (pie, bar, stacked bar, etc.), and there are also other built-in reports available that provide additional context.
Best,
Evan
FYI I am the VisualScript Product Manager
You must be a registered user to add a comment. If you've already registered, sign in. Otherwise, register and sign in.

Was this helpful?
Thanks!
- FAQ
- Community Guidelines
- About
- Privacy policy
- Notice at Collection
- Terms of use
- © 2025 Atlassian


You must be a registered user to add a comment. If you've already registered, sign in. Otherwise, register and sign in.