Community resources
Community resources
Community resources
How do I determine the amount of time a custom script takes?

Hey yall!
We are trying to optimise our Jira performance and I'm trying to find out which of our many custom scripts are contributing to the slowness. I was wondering if there was any way I could determine the amount of time taken by at a script to run to completion.
I've tried logs and chrome dev tools both of which didn't help much.
Thanks,
Adithya

Granted, these are manual methods and may take a little while if you have a lot of scripts, but if you have some suspects, I'd start there.
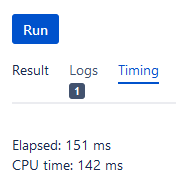
Console
If you have script that can be run in the Console, you can see the amount of time a script takes to run under the Timing tab:
Jobs, Listeners, Workflows, etc.
If your script is in a Job, Listener, Field, JQL Function, Workflow, and most of the places you can put a script, go to one of the those tabs in ScriptRunner.
History/Timing
You can see the Timing information by clicking History:
Then under Timing (you may need to scroll down):
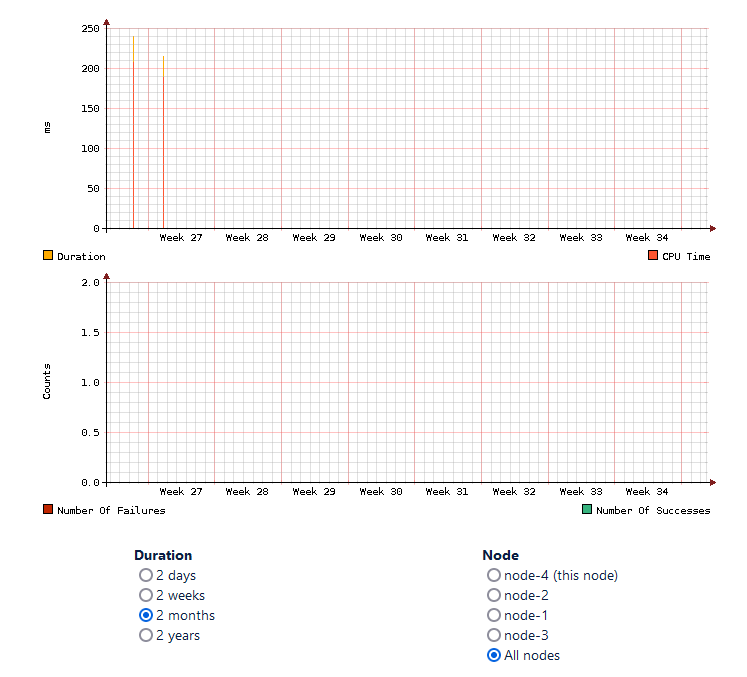
Performance
You can see Performance by clicking on the chart icon under Performance:
A pop-up screen with performance charts will appear. You can change the Duration and Nodes (for Data Center).
If this was helpful, please accept the answer.

Was this helpful?
Thanks!
Atlassian Community Events
- FAQ
- Community Guidelines
- About
- Privacy policy
- Notice at Collection
- Terms of use
- © 2025 Atlassian


You must be a registered user to add a comment. If you've already registered, sign in. Otherwise, register and sign in.