Community resources
Community resources
Community resources
⚗️Transform Data Into High-impact Executive Reports in Jira and Confluence
Creating executive reports that truly resonate with stakeholders can be a daunting task. Product and project managers often juggle vast amounts of data while trying to distill key insights that influence critical business decisions. The challenge? Making complex data clear, concise, and actionable for decision-makers.
Jira and Confluence are powerful tools for project and product management, but when it comes to executive reporting, their native features might not fully meet your needs. However, with the right tips to make the most of these features along with additional tools, you can craft custom, high-impact reports that deliver real value.
5 Tips to Create High-Impact Confluence and Jira Custom Reports
Ready to start developing eye-catching, data-driven reports with greater efficiency? Follow these five tips.
1 | Use Templates for Convenience and Consistency
Templates for reporting can save hours of manual effort and also ensure your presentation and formatting remain consistent for routine reports. Native Confluence templates make it easy to generate business status reports, executive reviews, and project status reports.
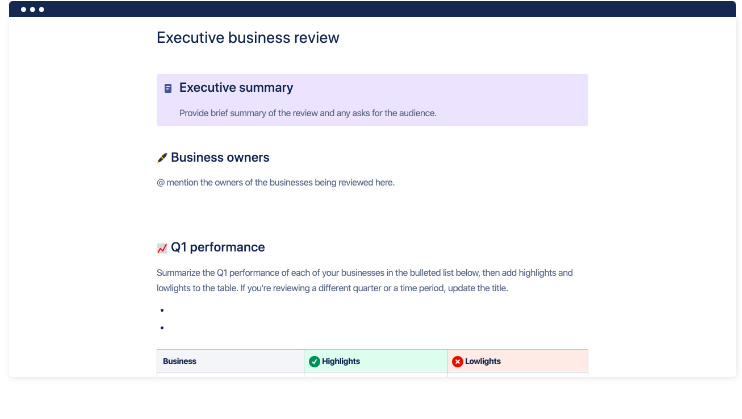
Caption: Example of an executive business review template available free on Confluence
Jira also provides templates for project reports for task planning, prioritization, and pipeline management. These templates include progress and issue status as well as estimations on time to completion.
💡 Check out free native Confluence templates for project management
While native Jira and Confluence templates are ideal for businesses with straightforward projects, customization features are lacking. If you need to bring in external data or combine results from both Jira and Confluence, it’s difficult to incorporate everything and share.
For greater customization of templates, consider an app that allows you to create Excel-like tables in Jira and Confluence and save them as templates, complete with pre-populated data. That way you can display exactly what you need and simply update the data without the need to create new tables from scratch.
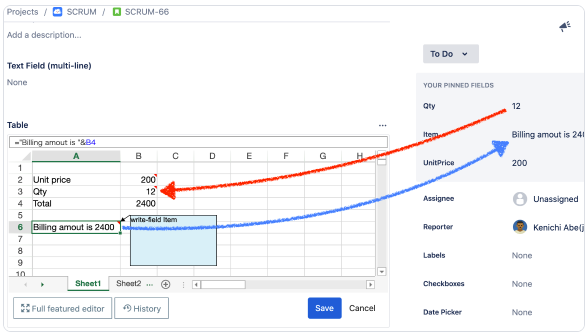
Caption: Example of a pre-populated table that can be used in Jira issues
2 | Automate Weekly/Monthly Status Reports
Regular status reports for stakeholders don’t have to be a manual chore. Automate them using Jira’s native reporting features and set update notifications for weekly or monthly reports.
Caption: Jira dashboard reports can display data from a certain period of time
With Jira and Confluence automation features, you can create a rule for generating Confluence pages or Jira tickets on a schedule. For example, generate a Confluence page showing all status updates once a week.This works well if all stakeholders are working in Jira.
However, when you can’t easily share dashboard reports or export native tables, an app comes in handy. For example Excel-like Tables for Jira and Excel-like Tables for Confluence allow you to track project and individual issue status in Excel-like sheets, quickly filter for key data, and export it as needed.
3 | Make Reports Interactive for Presentations
Large amounts of data presented at once can be overwhelming for stakeholders. Adding interactivity to reports keeps executives engaged and ensures that the key points and their impact are easily digestible.
Confluence databases allow you to filter data and show different views so you can zero in on specific points before moving to the next one. Jira reports also enable filtering to focus on the data that matters most as long as it fits within the parameters of the standard native reports.
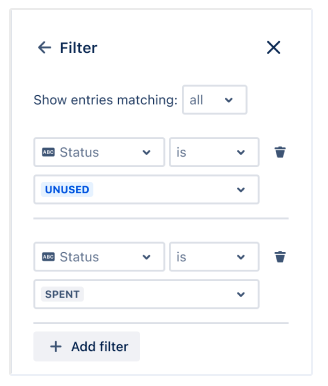
Caption: How to set up a filter in a Confluence database
For more complex presentations, use an app to incorporate Excel-like documents in Jira and Confluence to manipulate data to give custom insights. Advanced table functionalities like pivot tables allow you to summarize and visualize large datasets efficiently in table format.
4 | Leverage Charts and Visualizations for Quick Insights
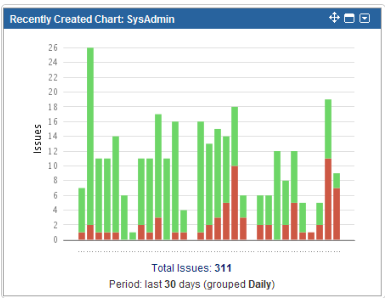
A picture is worth a thousand words; a chart or graph can instantly bring clarity without the need for lengthy explanations. Use Jira’s native charts to highlight trends and patterns in various formats. Colorful dashboard gadgets can be exported for use in presentations and clearly illustrate the big picture.
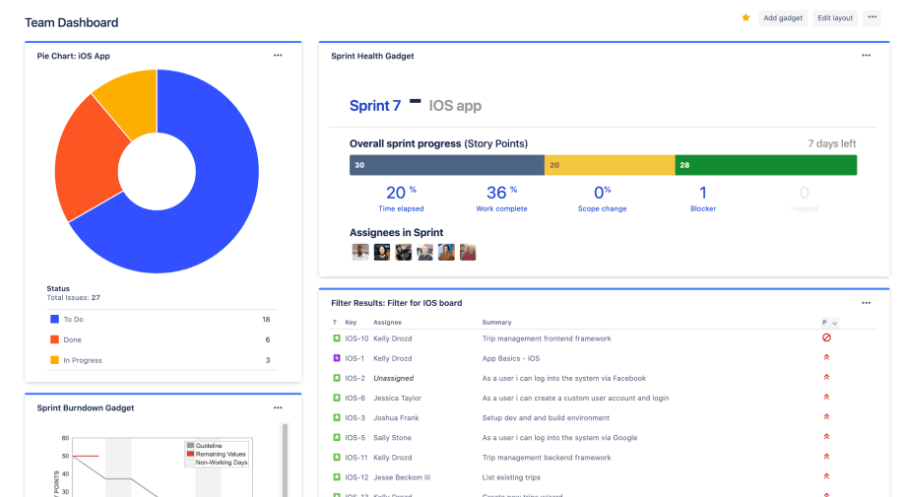
Caption: Jira’s native dashboard charts make data visually appealing
For more complex visualizations, external plugins like Excel-like Tables for Jira or Confluence allow you to create custom charts, making it easier to present visuals that tell a compelling story. Far beyond tables, you can choose a wide range of customizable shapes and charts, from pie charts to histograms to present your data most effectively.
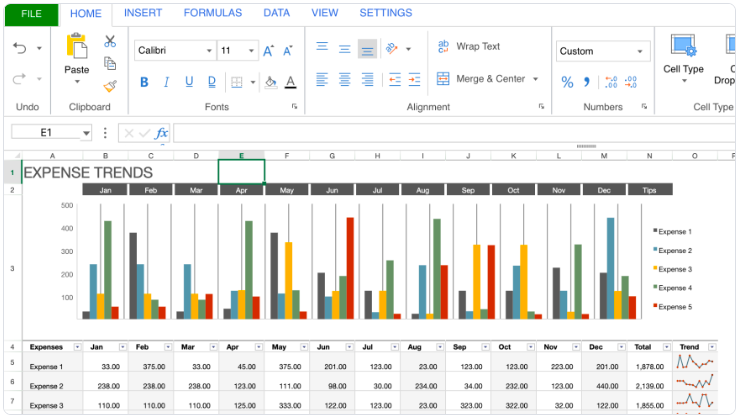
Caption: Example of a chart you can create
5 | Convert Confluence Tables Into Excel Documents
When external stakeholders who are not using Confluence need access to your data, exporting a report can be a challenge. While Confluence tables can be exported to Excel, the formatting may not always translate perfectly. Using an add-on like Excel-like Tables for Confluence ensures a seamless conversion process, so you can edit Excel-like tables directly in Confluence and export polished documents.
Ready to Take Your Reports to the Next Level?
High-impact executive reports are all about presenting the right data in the right way. By leveraging templates, automation, interactivity, and advanced visualization tools, you can transform raw data into actionable insights. If you want to expand your reporting capabilities, try Excel-like Tables for Jira and Excel-like Tables for Confluence free.
📊 Try Excel-like Tables for Jira
📈 Try Excel-like Tables for Confluence
Was this helpful?
Thanks!
Raziman Dom - Ricksoft
0 comments