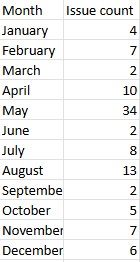
Hi, we wanted to have an overview of the month wise issue count based on the "Start Date" in the tasks. Basically, a bar chart or simply Month & Count in a table view side-by-side.
Is this possible with native Jira dashboard gadgets?
Example of the output required -