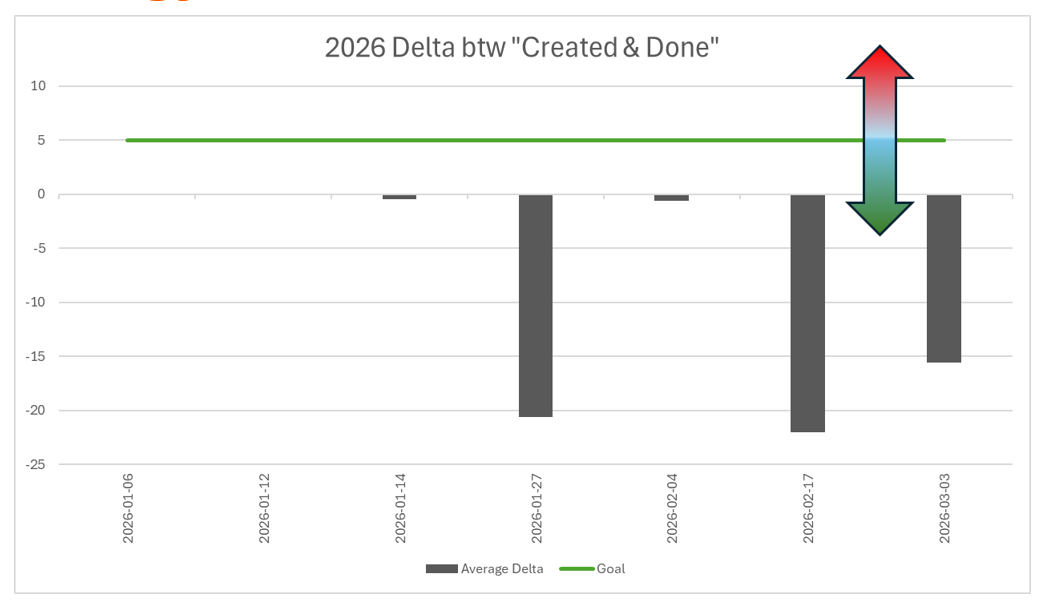
I'm using a gadget called custom charts for my dashboard, and I'm trying to make a chart that will show the delta difference between created and resolved and plot the delta values, and to show on a monthly or by quarters. It would be the average delta being plotted. I have attached a screenshot of what I'm trying to do. Does anyone have any suggestions on how I can do this or can this be done using some automation of some kind.