Hey everyone 👋
We’ve seen a lot of teams struggle with sprint burndown accuracy when their work is split into subtasks. Jira’s default charts tend to skip subtasks entirely so even when your team finishes a ton of work, the burndown barely moves.
Here’s how we’ve been approaching it using the Great Gadgets app for Jira and Confluence and how you can get a clear, real-time view of your sprint progress with subtasks included.
Challenges with Jira’s Native Sprint Burndown Chart
Jira’s native Sprint Burndown ignores the sub-tasks, only showing progress when parent stories are closed. That means your chart doesn’t really tell the full story until the very end of the sprint.
The solution: Great Gadgets for Jira or Confluence
With Great Gadgets, you can finally build burndown and burnup charts that actually reflect what’s happening day to day.
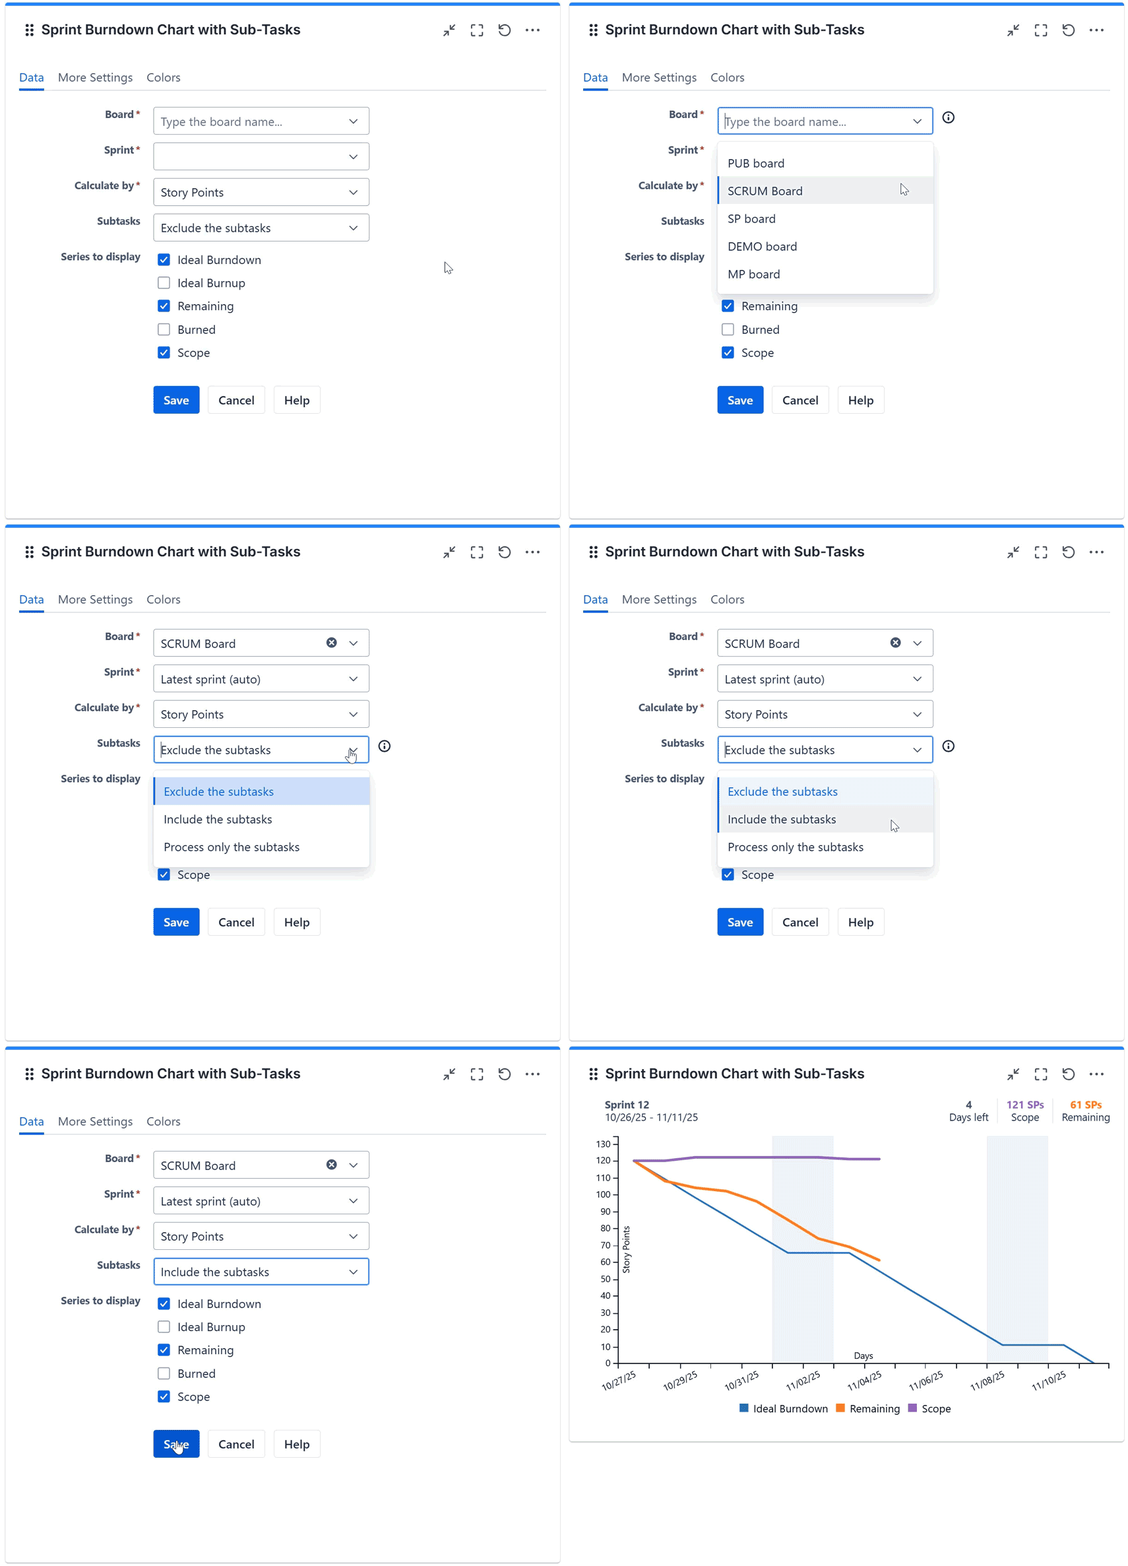
✅ Include subtasks (or track only them if you prefer)
✅ Customize estimation methods for your team’s workflow
✅ Switch between burndown and burnup views
✅ Get real-time, visual insights, right inside Jira
Great Gadgets app offers a Sprint Burndown Burnup Chart gadget that allows tracking sub-tasks.
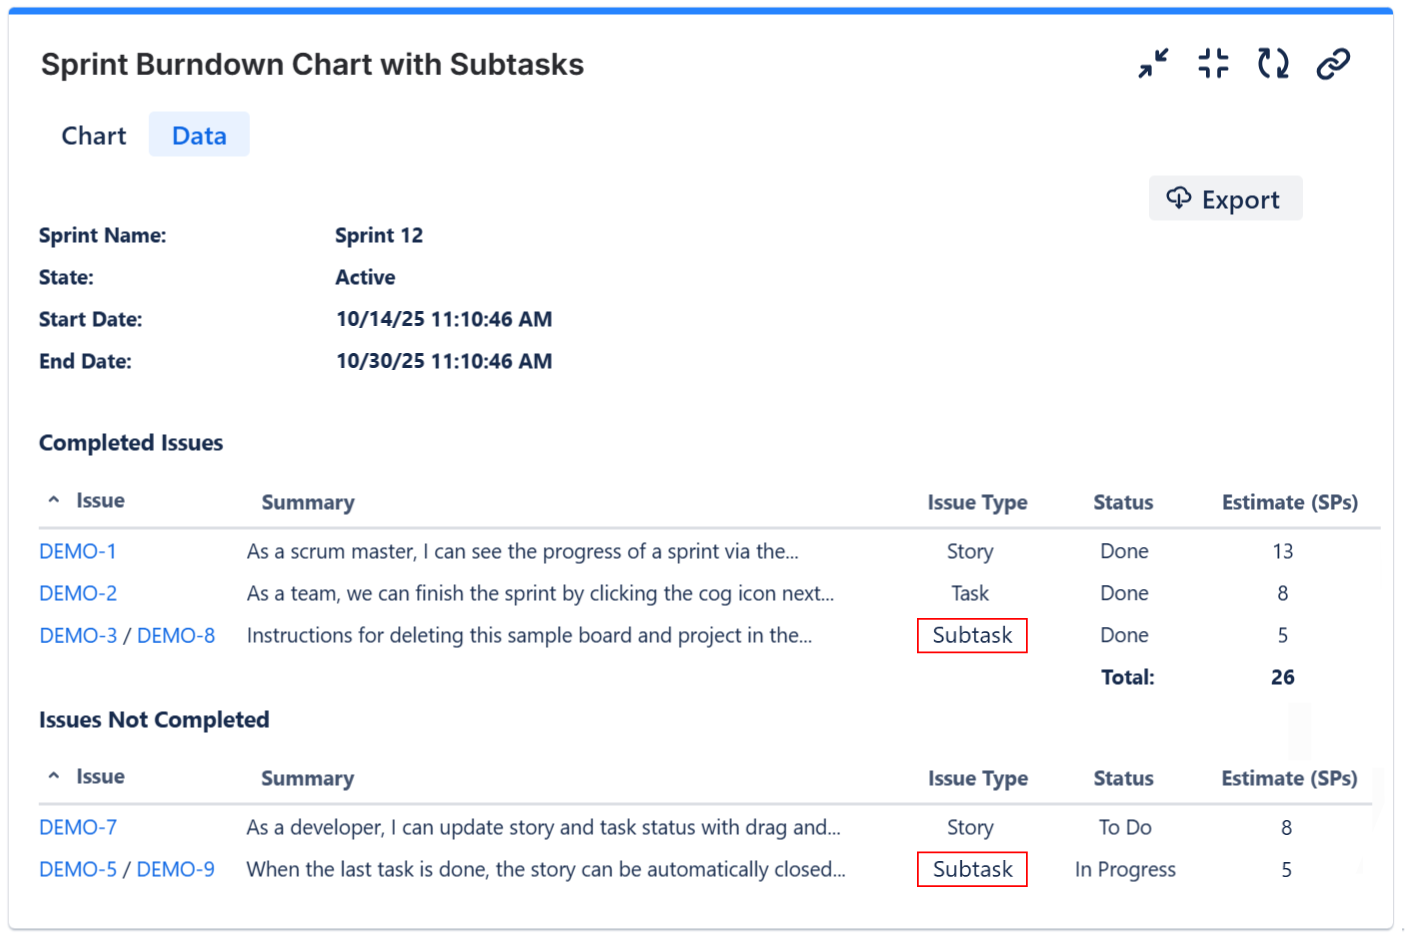
💡Tip - You can even visualize a complete sprint report with subtasks included, which you can easily export it to CSV for analysis or sharing.
Why It Matters
With subtasks included, your burndown chart becomes a true reflection of sprint progress. Teams get better visibility, Scrum Masters run smoother retrospectives, and no one wastes time explaining why charts look “stuck.”
Are subtasks supported in other app gadgets?
Great Gadgets offers many other gadgets that can include the subtasks in their calculations:
- Team Velocity gadget
- Release Burndown Burnup Chart gadget
- Cumulative Flow Diagram (CFD) gadget
- Control Chart gadget and more.
So all you need for an insightful dashboard, with full support for subtasks.
👉 If you’d like to test it out, it is free for 30 days on the Atlassian Marketplace:


