Hi Team.
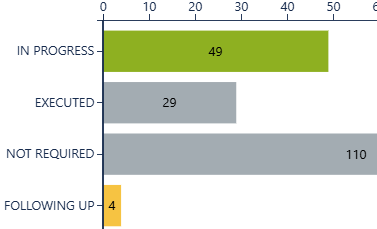
I am trying to build a chart that gives me a visual of the number of items in certain statuses and that fall in a certain date period
In my table toolbox, I have a table filter and a table excerpt include that gets the data/table
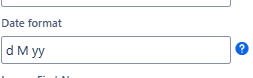
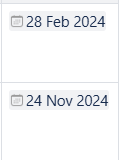
I am using Table filter to add a hidden date filter to show only the data/rows that fall in a certain period- a range from September to October and in the table itself, they were entered in confluence date format '//'
When I publish the chart I still get everything and not that the Table Filter 'filtered'. Why are my numbers wrong?


