Hi,
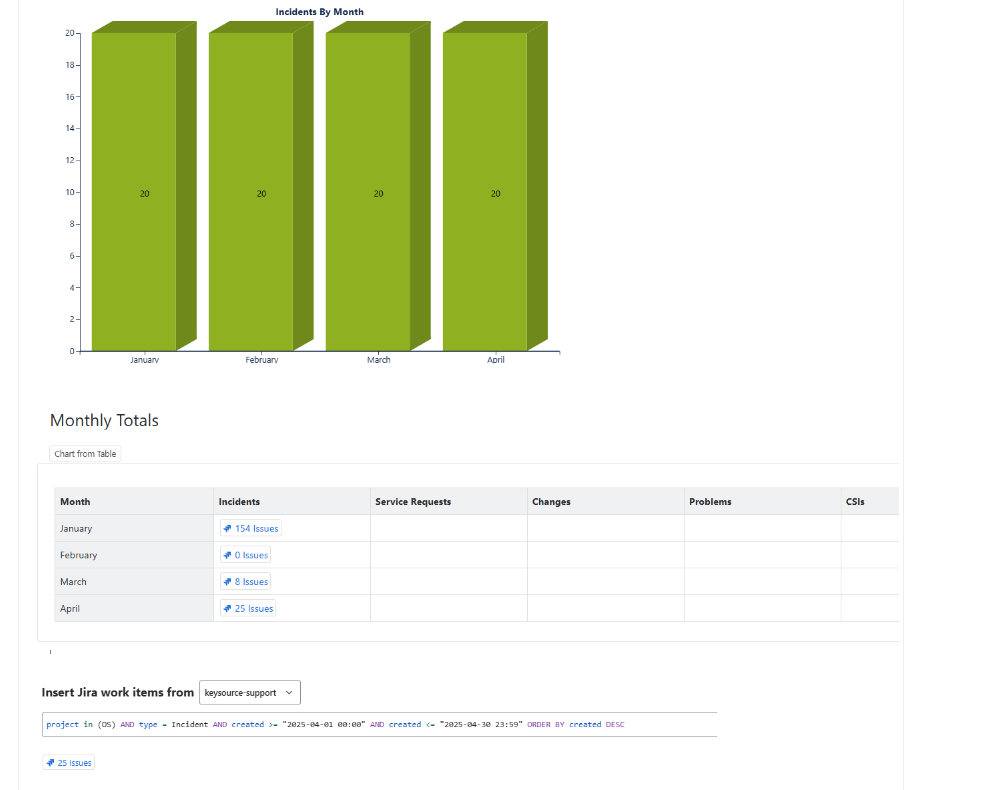
I am trying to create a graph for Incidents, Service Requests, Changes, Problems and CSIs grouped my month on a Confluence Cloud page and having issues.
I have created a table and put Micros in each cell calculating the total per month as per my screenshot, I have removed all but Incident while trying to fix.
I have the table wrapped up in a Chart from table and for some reason the months total 20? and can't understand what I am doing wrong but new to Confluence Cloud so could be something stupid.