Using Analytics, I am working on time in status template dashboard and charts.
Does anyone have any experience with the setup for this?
Questions:
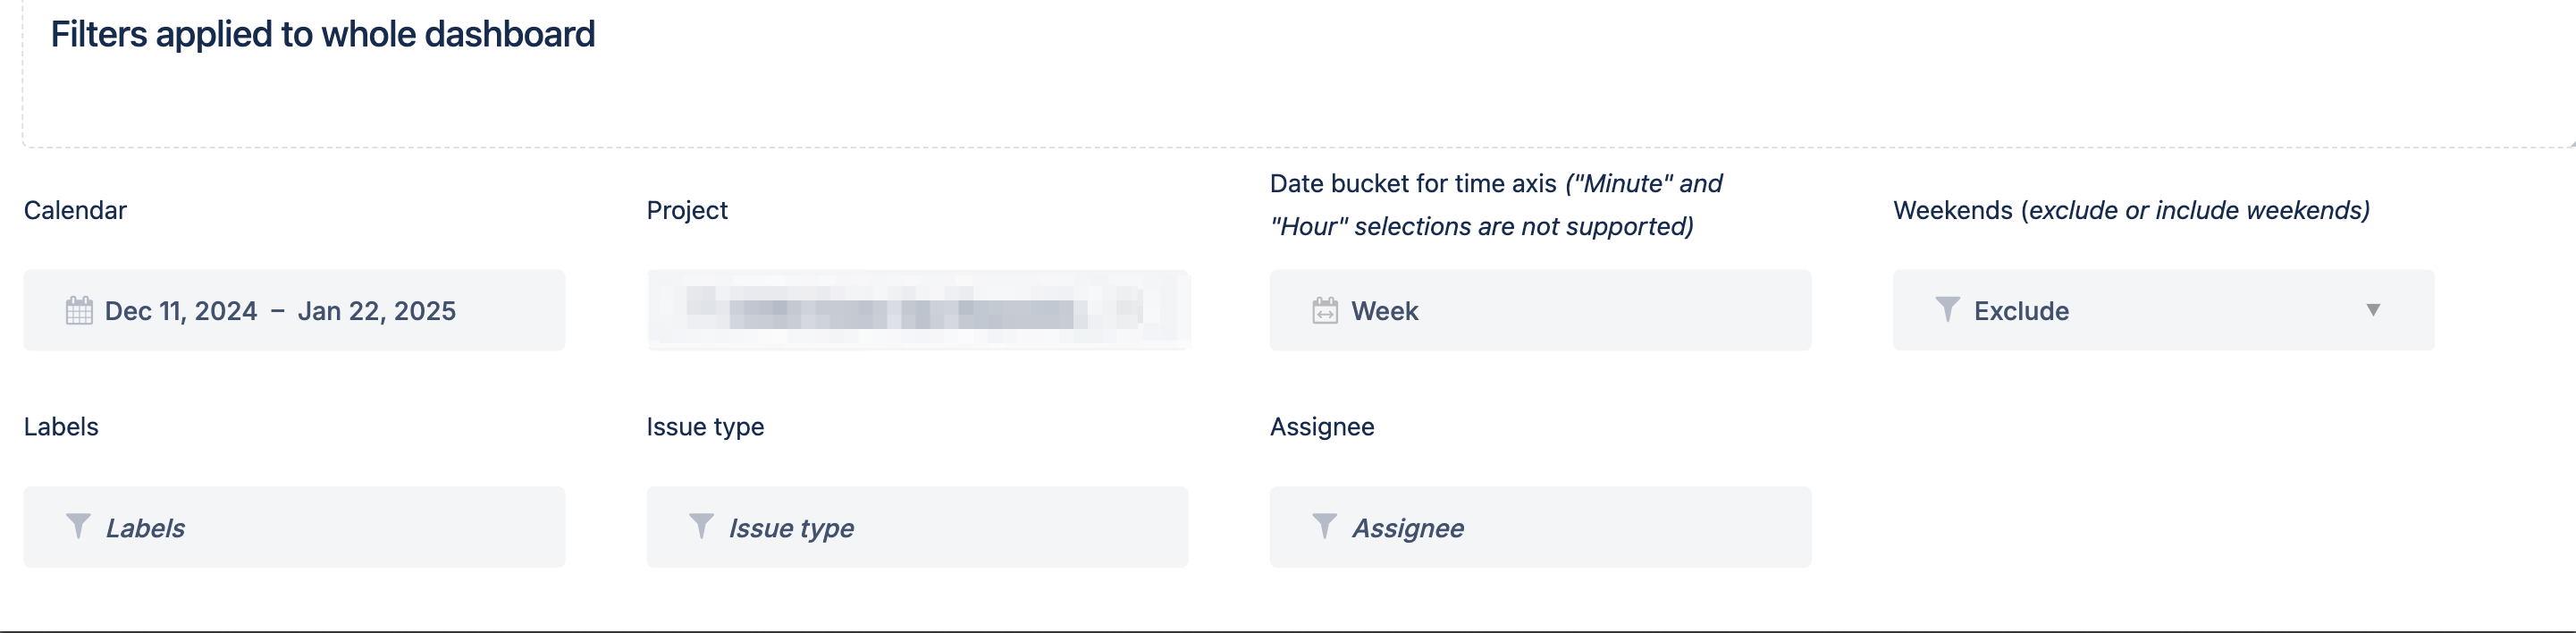
Any suggestions for better filters? (Screenshot #1)
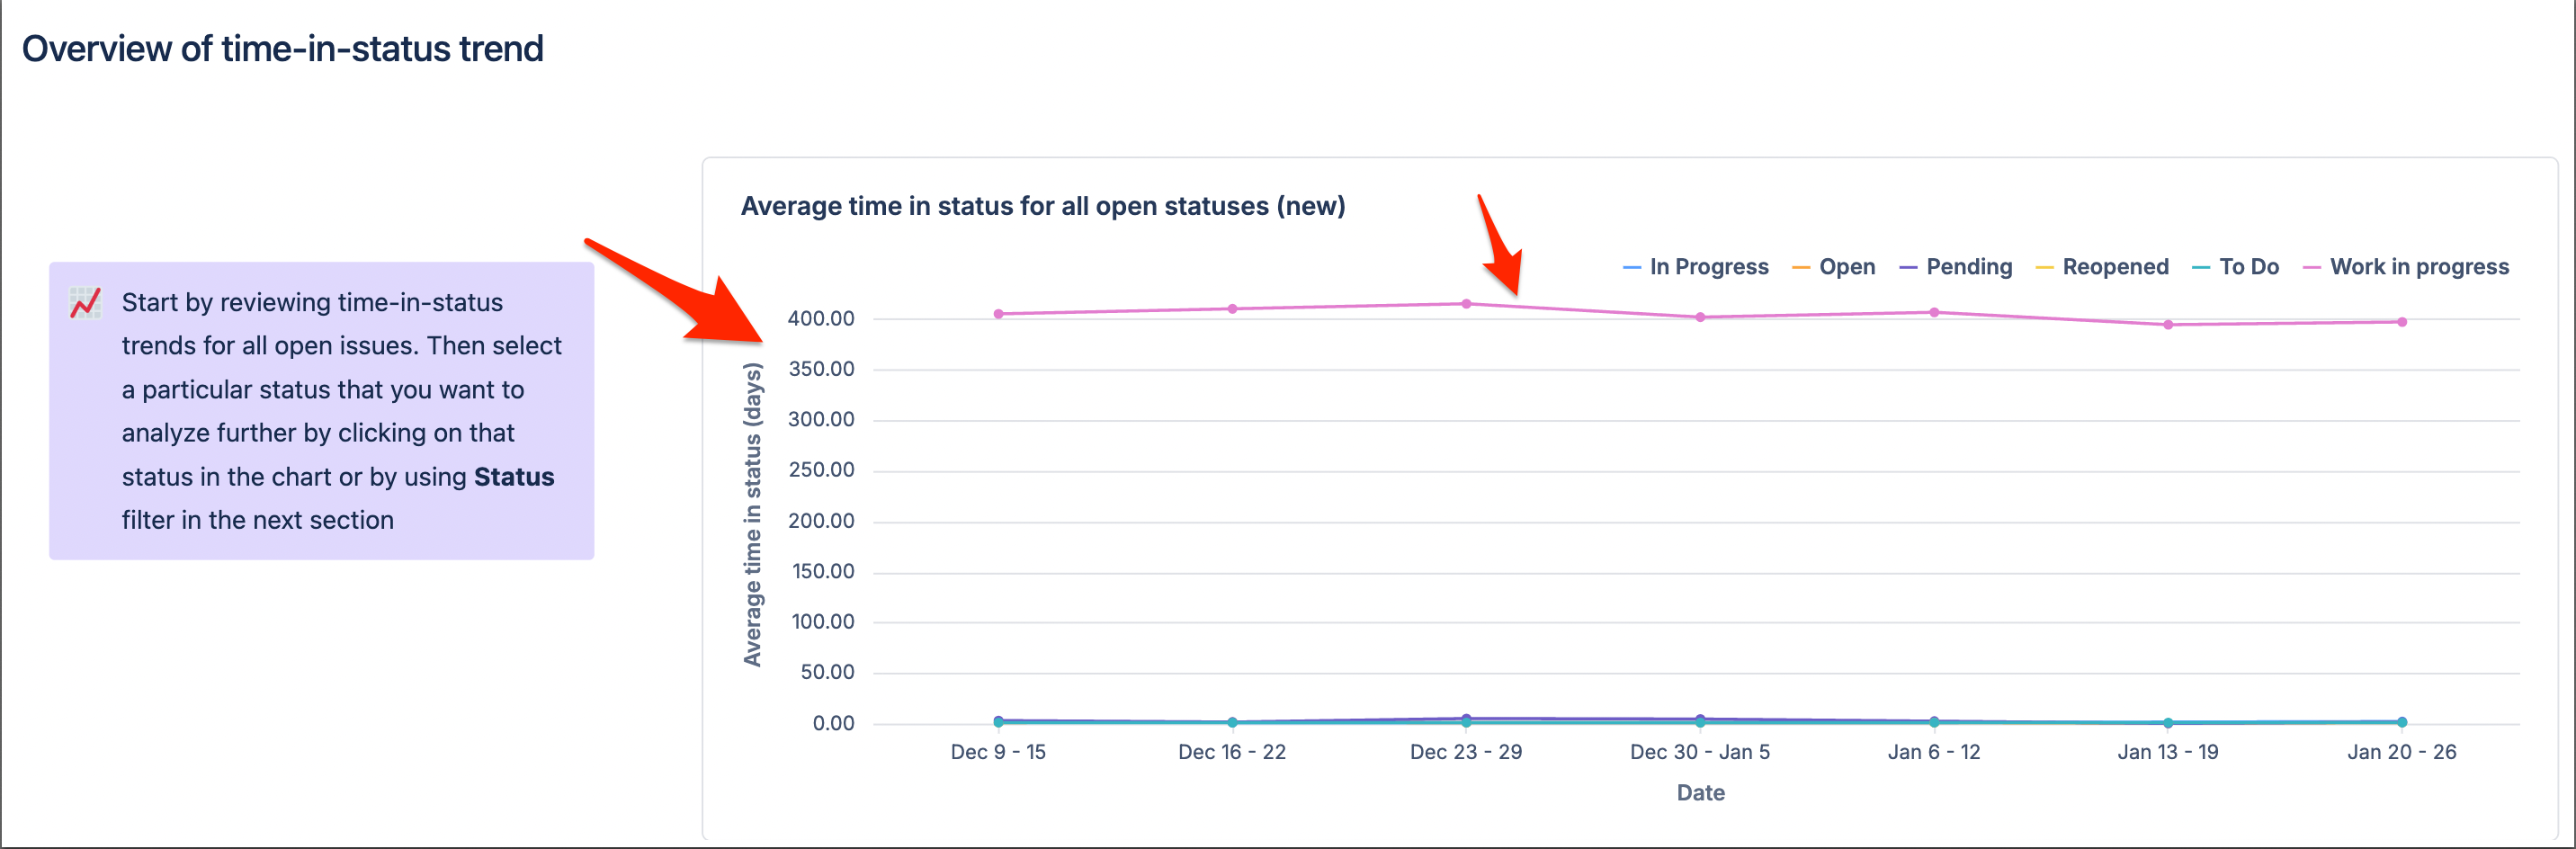
On the charts, I am not exactly sure what "average time in status (days)" means as it relates to this chart. (Screenshot #2)
Not sure what the pink line on the top represents. (Screenshot #2)
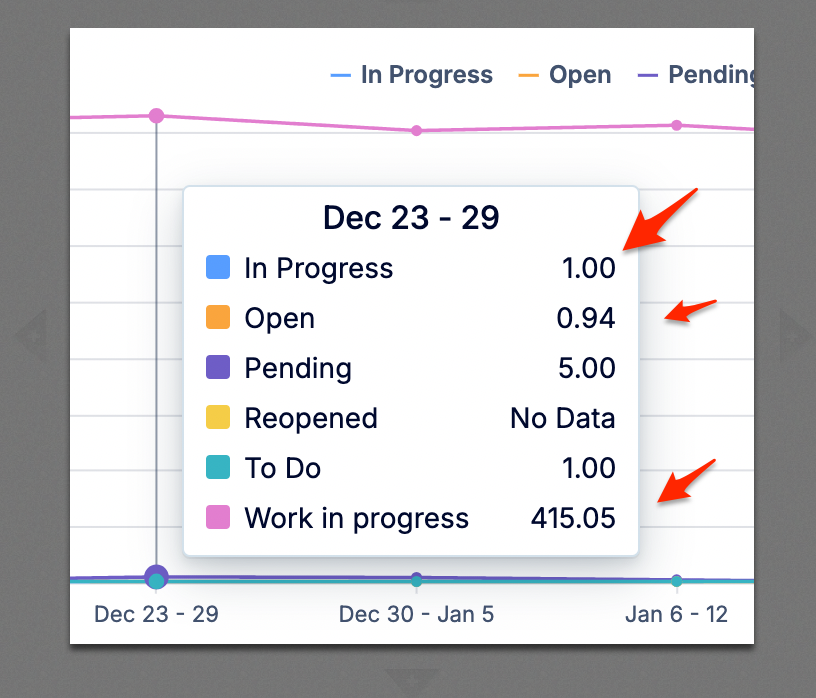
Not sure what the numbers represent for pending, open, In Progress or work in progress. Is it counting Days? (Screenshot #3)
Thank you in advance for any guidance you can provide.