I'm currently using the Advanced Issue Filter Formula Gadget from Great Gadgets to do some computations based on JQL filter results. I'm primarily using that gadget to count the results of some JQL queries and then performing some calculations on those counts. I'm happy with the numeric results, but I'm needing something that's a bit more flexible, and something that gives me the ability to display data from multiple projects in a single gadget rather than one per project.
I'm wondering if - for example - it's possible to execute filters or JQL queries and count, add, or average those results, then perform additional calculations on those results... maybe as in a spreadsheet? For a specific example: can you create a table in some gadget, count the number of filtered results, then multiply that number by another count of filtered results, then perform some other rudimentary math against those results?
I'm trying to replicate an Excel spreadsheet that is 100% composed of Jira data that's being gathered and presented in various forms on existing dashboards; I'm not super excited about looking for spreadsheet-like solutions. The last thing I want is to have my execs reading my sophisticated dashboards and cramming all those values into a static Excel spreadsheet. I'd much rather generate live content straight from Jira/Confluence.
Any ideas?
EDIT
So, I realize I didn't provide much context. Here's what I'm dealing with:
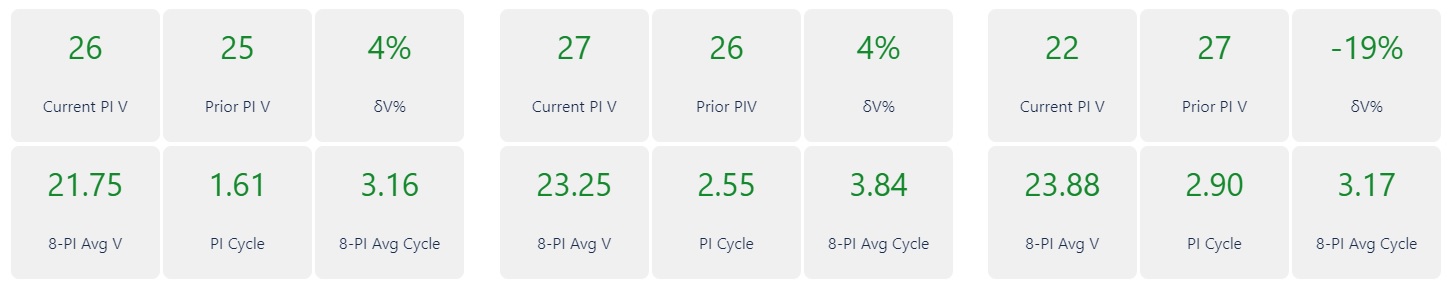
This is data from 3 teams (in reality, we have 8 teams) providing current PI velocity, prior PI velocity, delta velocity, 8-PI velocity average, current PI cycle time, and 8-PI average cycle time. All the data except the cycle time data is "live", i.e. it is real-time. The cycle time data points are static; each time we present this (fortunately, once every 2 weeks), we have to manually update these values, given that calculating cycle times involves a lot of API work; thankfully, Great Gadgets provides us with all this information in their Cycle Time gadget. While this live data tells the story, it's spread out in a huge Confluence page.
In comparison, the same data - albeit static and harvested from various gadgets on various dashboards for all 8 teams - takes up minimal space in Excel:

It feels to me like I need to "do better" than a huge matrix of the above Confluence gadgets, but the Advanced Issue Filter Formula gadget is the only one I know about that will allow me to capture and manipulate the data in the ways I'm doing above.
I need some serious help. I'm honestly not interested in back-feeding this information into Excel; I'm already fighting a never-ending battle to get my execs off of Excel for our Jira/Atlassian-based projects.
Many, many thanks in advance!


