Hi there! I am in the process of migrating my team from Excel to JIRA/Confluence for our 2025 roadmap. We have a custom JIRA field for all of our projects, which are defined at the Story level. For help visualizing our capacity to our leadership, I need to be able to display the current sum of our custom field (weighted minutes) against our capacity number.
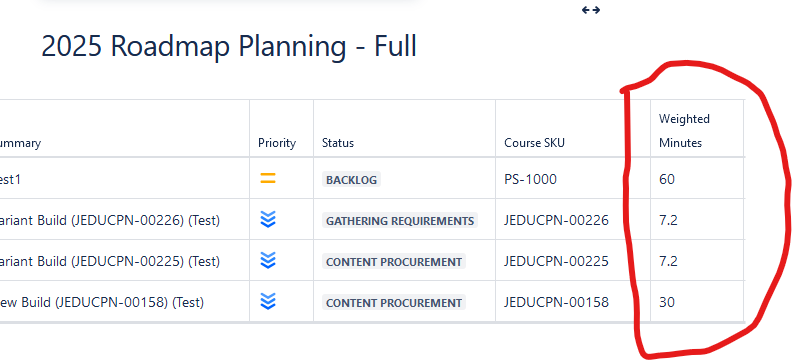
For a quick example, what I'm looking for would be a way to display the sum of all values in the weighted minutes field shown below. Ideally, it would be in a graph, but even just a simple sum at this point would be fine.
The table is populating using JIRA Issues and a filter.
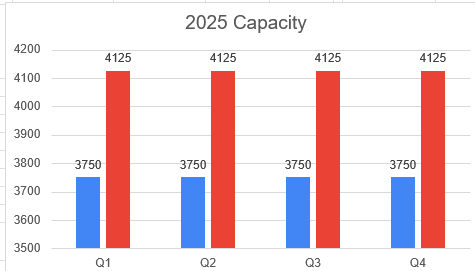
What we currently have in Excel looks something like this, with blue being what would be the sum of the weighted minutes field, and the red our capacity.
Please let me know if anyone can help here or if this has been answered elsewhere. I looked around but couldn't find anything that fit.


