Hello,
I am fairly new to Kanban and have been building out multiple charts/graphs in Dashboards that our upper leadership can quickly load and review everything. So far all is well and is producing everything we need. There is however one graph I'd like to create and are having difficulties getting one very important data point to load.
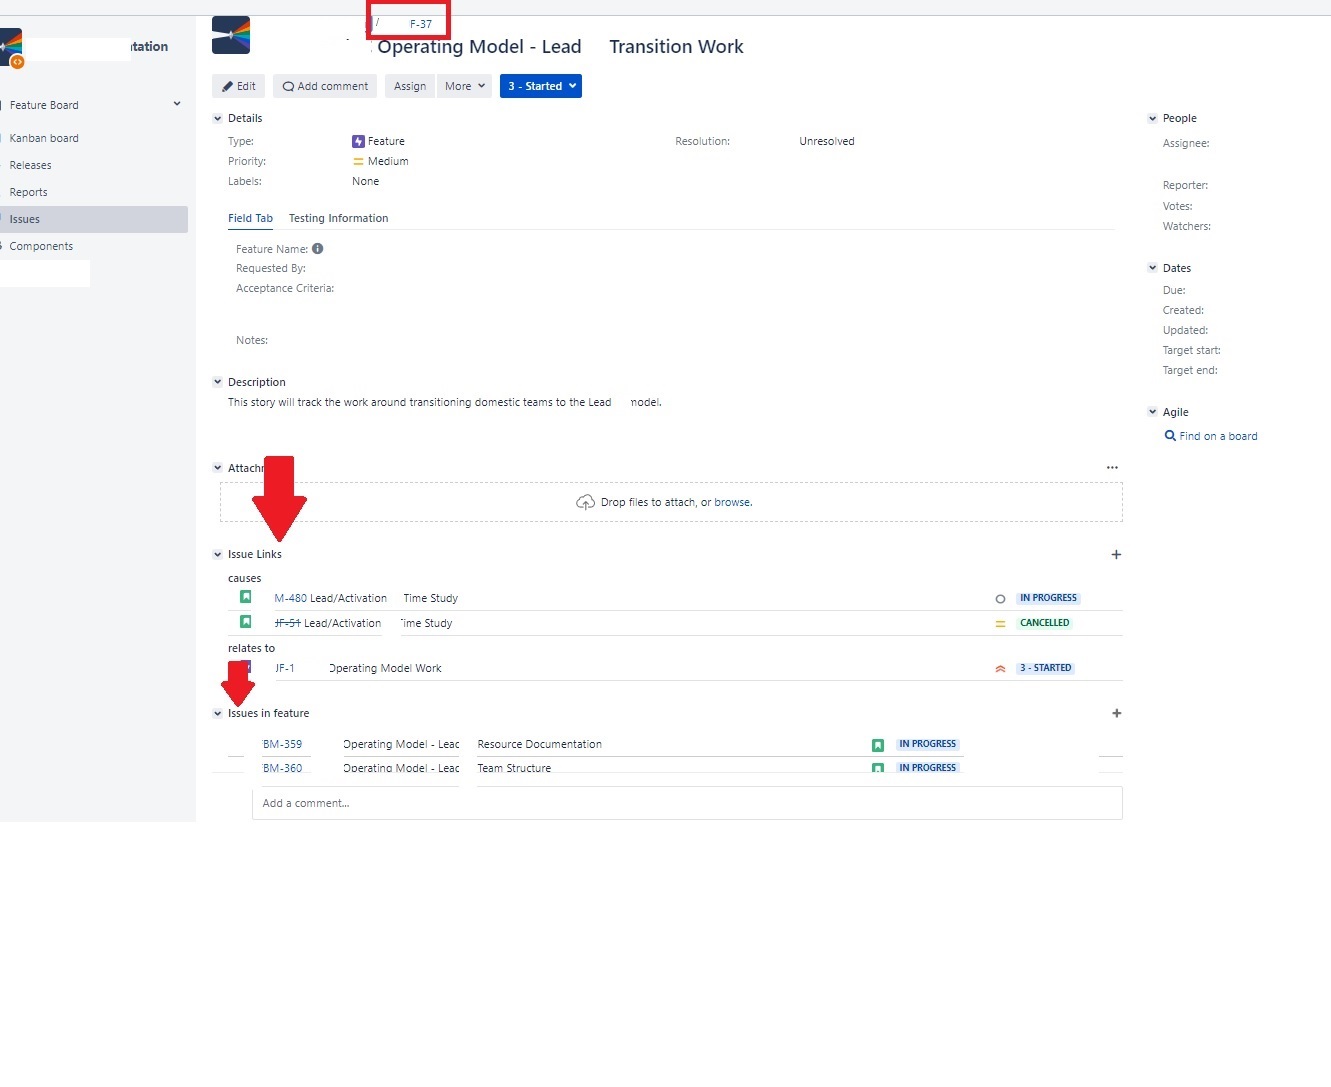
Background: We have 2 projects. 1 used for creating "Features" and the other "Stories". Feature being the main project and stories are used for creating sub-issues that are linked to a feature. In the attached screenshot#1, you'll see this is a main issue (feature, end with JF) and where the red arrows are you'll notice "Issue Links" (which I can load into my graph just fine). Main issue here is that all of the stories (ones that end in BM which is under Issues in feature), those I'm not having any luck pulling in.
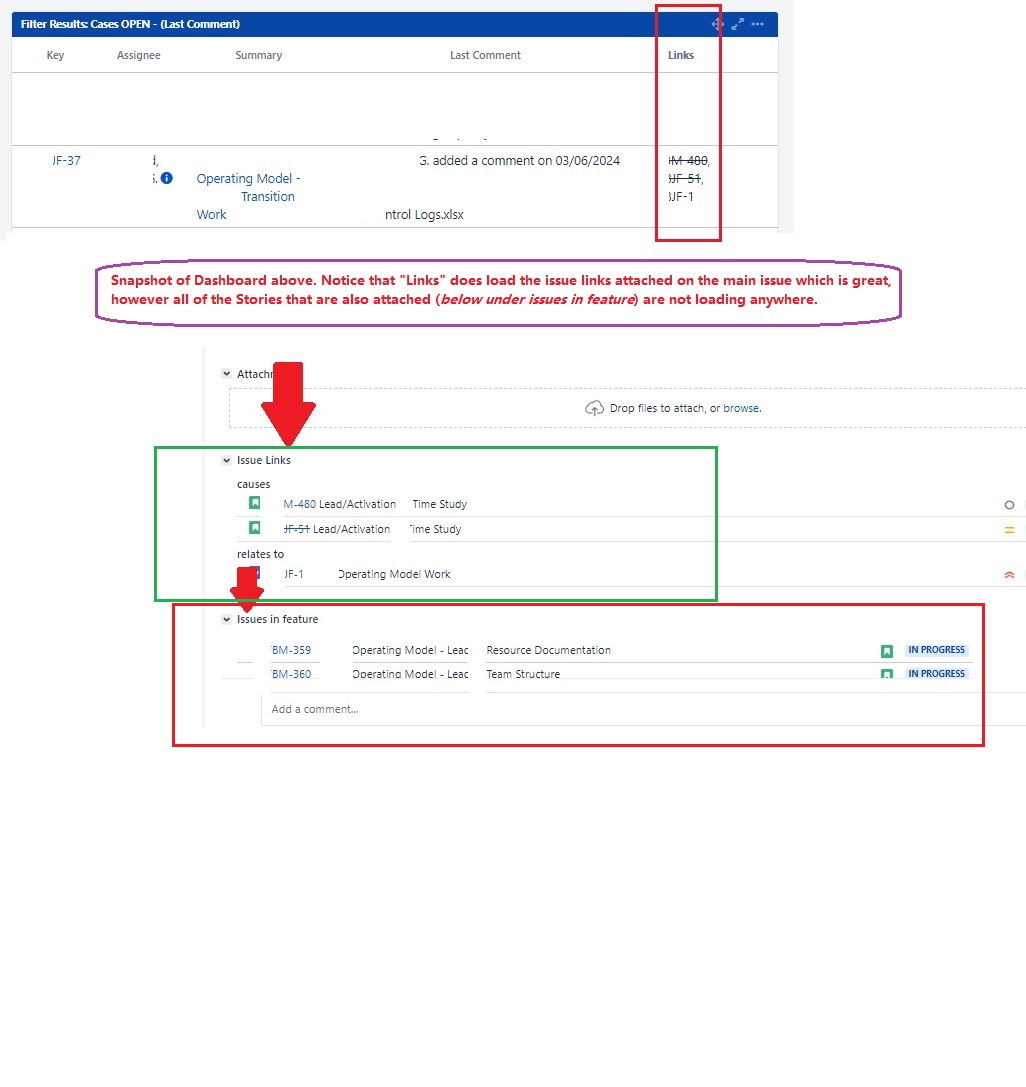
*I added Screenshot#2 just to show how the chart looks like in my dashboard and the results I'm getting.
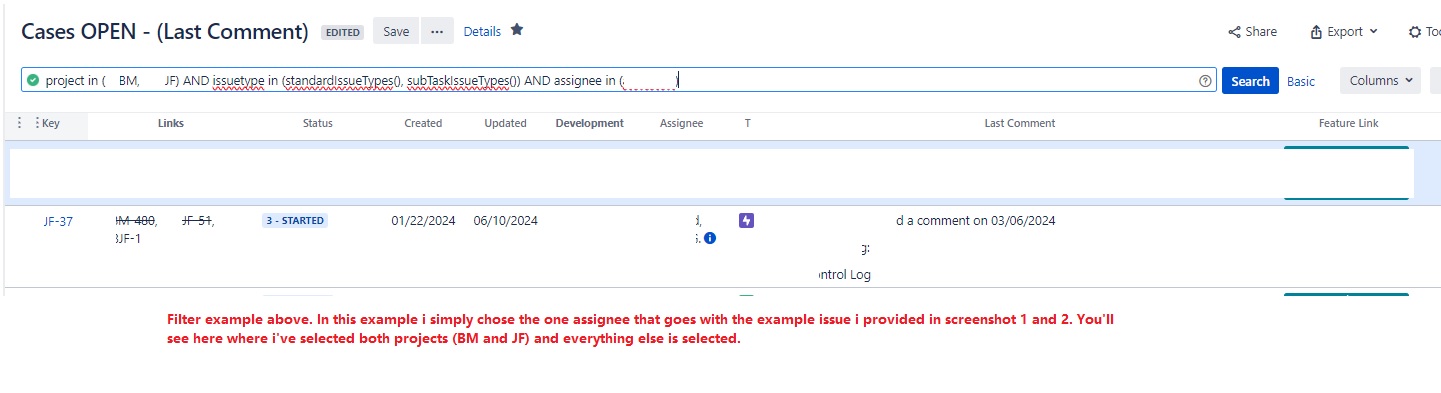
Lastly, from a Filters perspective I am using basic formatting and not advanced. I do have both projects selected. I have tested dozens of columns to try and see if it would load these stories, but nothing has worked thus far. There are over 100 columns so it's very possible I've simply chosen the wrong one.
Does anyone know of a way I can generate the stories when creating a filter? Screenshot#3 will show how the filter looks.
Thanks in advance for any assistance with this.
-MT