Hello community,
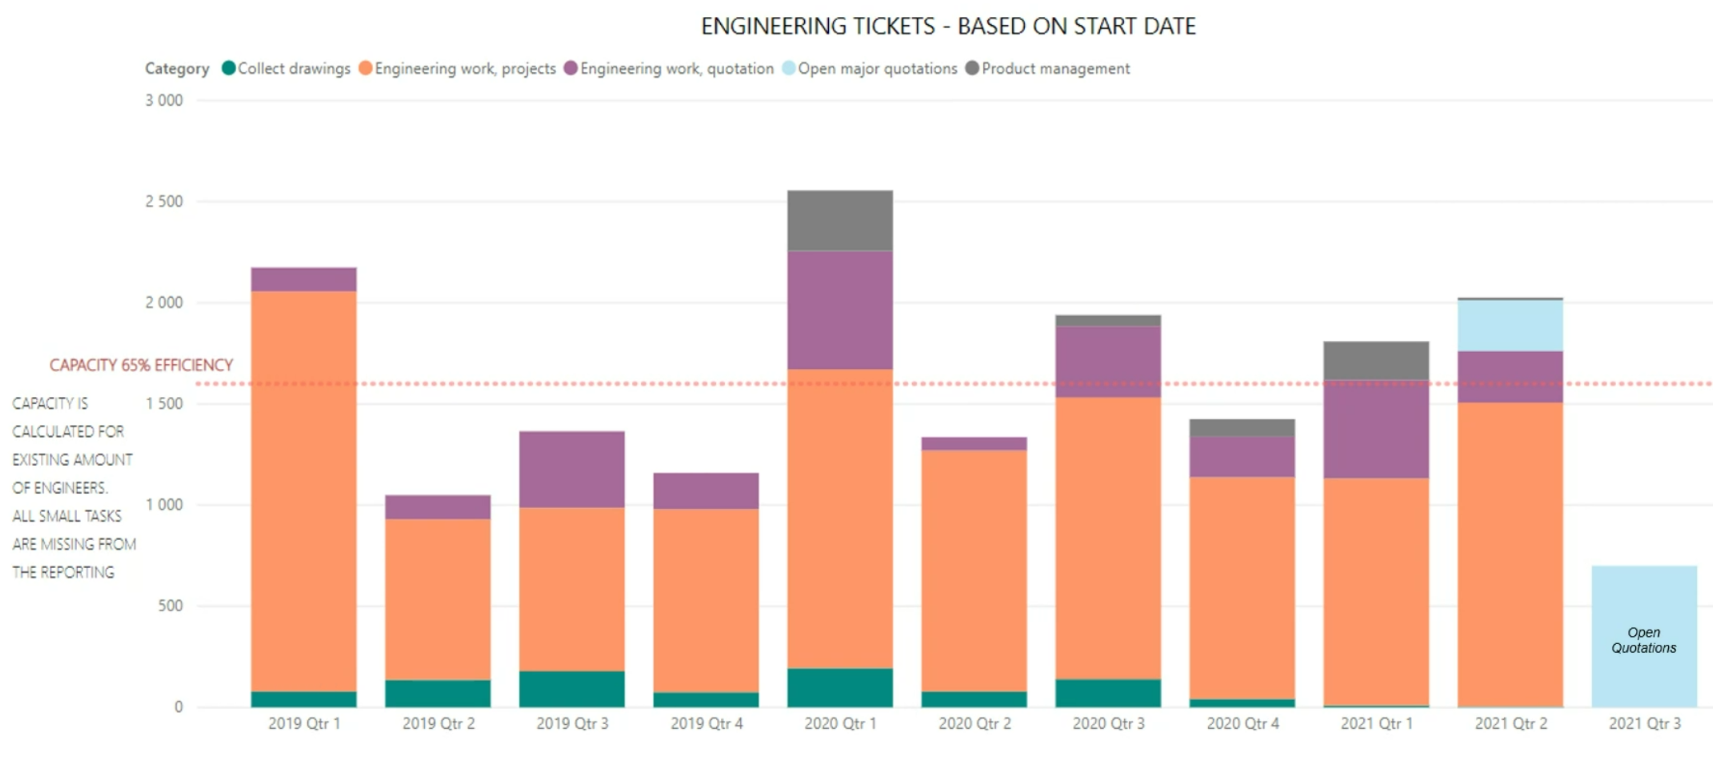
I'm piloting Jira ticketing for our mechanical engineering team as a first-timer. I was wondering if it would be possible to produce such a diagram using Jira's tools or BI.
At the moment, categories are Components. The Y-axis is cumulative hours, and the X-axis is obviously annual quarters. Hour tracking is done by integrated Tempo.
Let me know if something is amiss.