Hi,
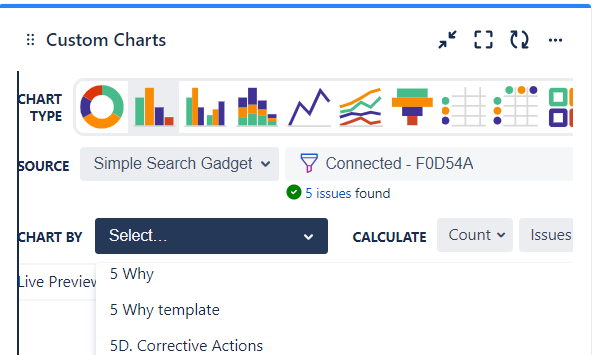
I created a Jira board with customized fields with Dropdown buttons. My need is basically plot charts with the amount of issues that was raised with this custom fields selected. For example: I would like to plot the amount of issues raised with Process selected, but when I go to chart by, I cant find this field there and I dont really know how to do it.
Anyone could please help me ?