Hey There!
Not sure if I have any Time in Status whiz kids out there, but I'm in a company managed project using the Time in Status (add-on) to deduce the ticket lifespan from Open to Done. Aside from looking at Avg. Cycle and Lead time, I also have columns for the individual statuses this specific board uses.
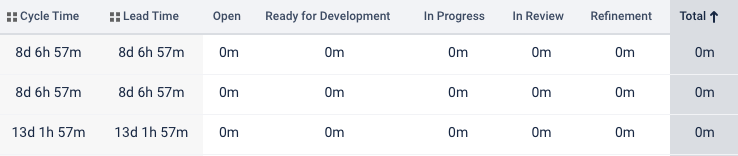
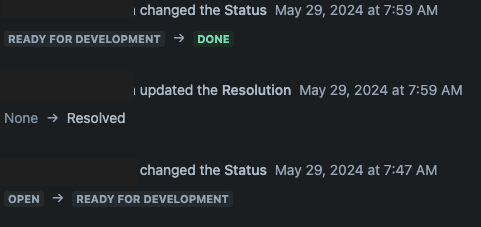
For three issues, it displays 0m for Open, Refinement, Ready for Development, and In Progress. However for all three tickets, the user transitioned from Open to Ready for Dev for at least 5-8 minutes, so not sure why it isn't being captured.
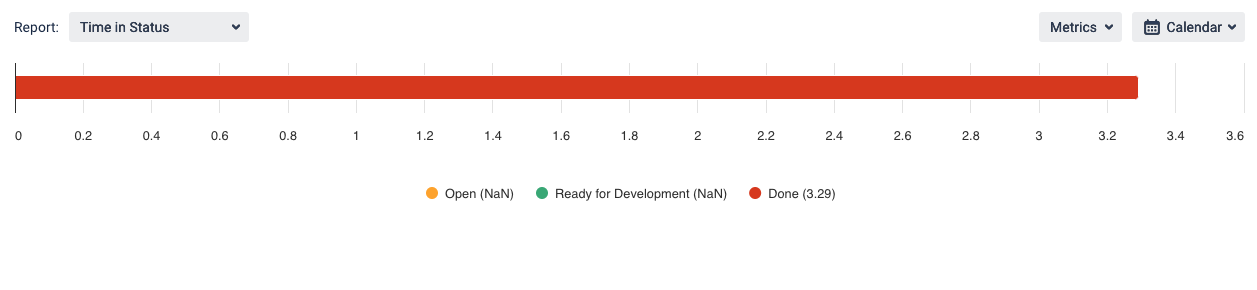
When I look at Time in Status on the individual ticket, the graph also is really confusing to me.
Any assistance with my brain melt would be appreciated 😂
How it displays on the report from the App (below). I removed DONE because it skews the data by how long the issue has been in DONE, not necessarily how long it took to complete.
History for one of the issues in question:
Time in Status graph from one of the issues in question:
Thank you in advance!

