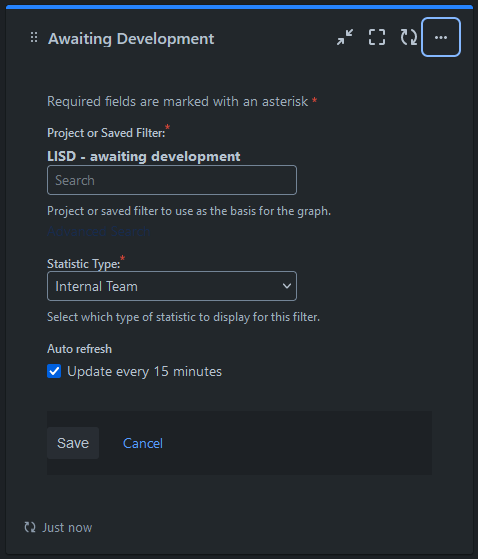
I've set up a new filter within my project and have added a pie chart gadget to my dashboard to display the results of this filter, and the chart is displaying incorrect statistics.
The filter is returning all issues within the project that are a certain status, and the Statistic Type of the Pie Chart is a new Context Field that I have added to the request type in the project settings. The end result being, show me all tickets with status "Awaiting Development", broken down by "Internal Team" Context Field.
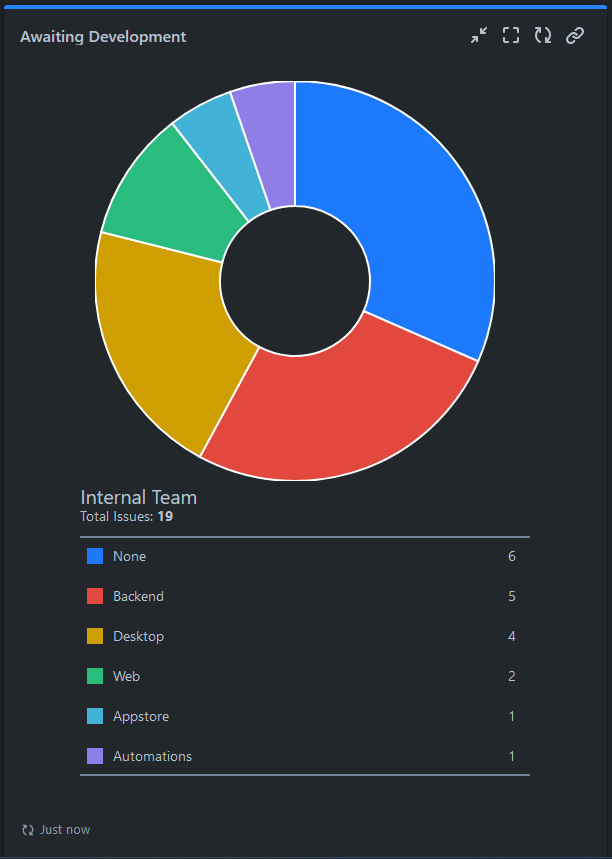
The issue here is that all 19 "Awaiting Development" tickets have an "Internal Team" selected. There shouldn't be a "None" portion in the results. If I click on the "None" portion of the chart, I'm taken to a new page with the jql query showing 0 results. The displayed values for the other "Internal Team" values are also incorrect e.g. there are actually 8 tickets with "Backend" Internal Team value.
Not sure what I'm doing wrong?
Additional info:
- I have "Update every 15 minutes" ticked for the gadget
- I have waited ~30 minutes after adding the gadget with multiple manual refreshes to see if the gadget fixes itself