I'm using the graphics widget on a confluence page to show some data in a pie chart.
I have initialized the data with a table and I'm pretty happy with the result.
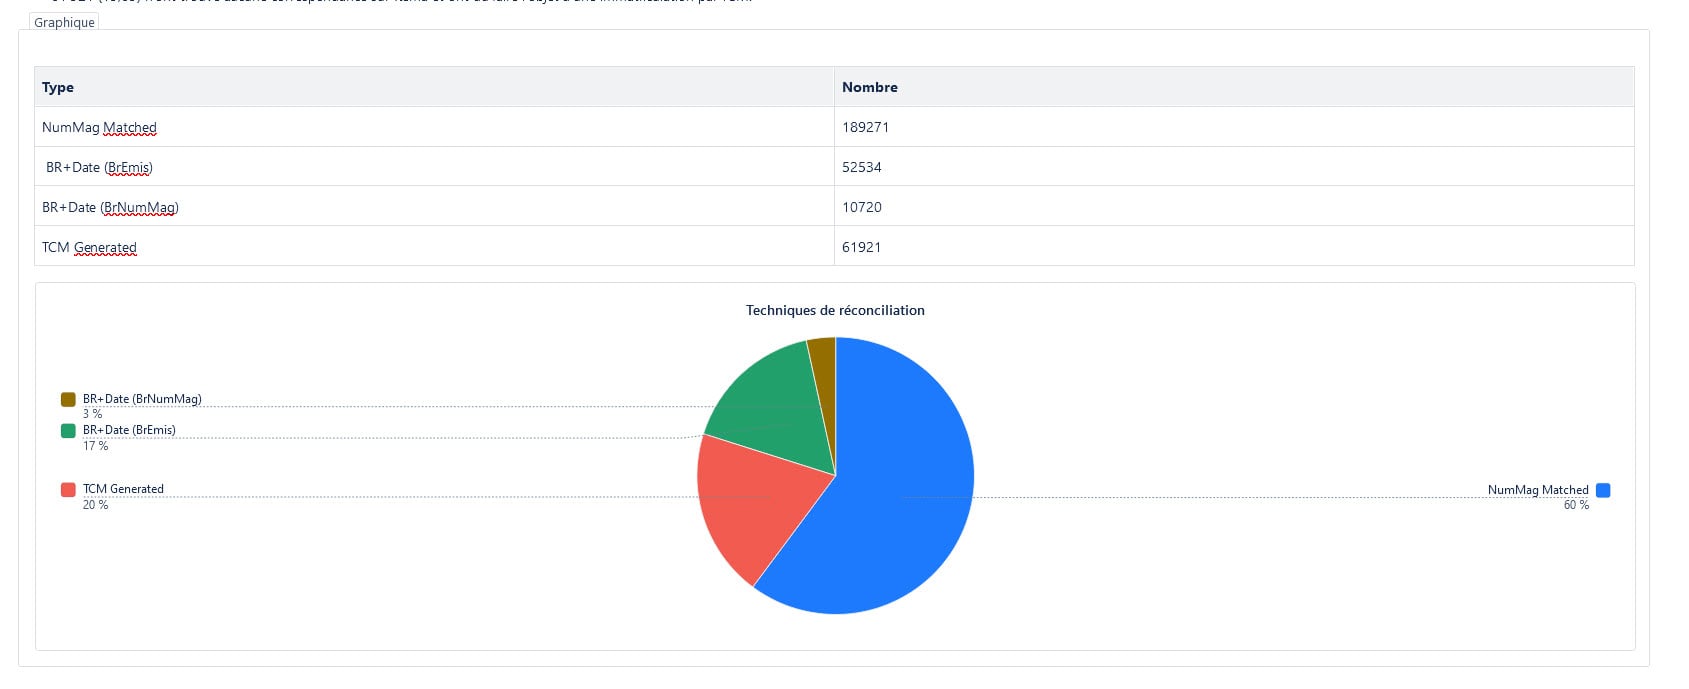
But once I save my changes I notice that the rendering of the graphics I see in edit mode is not at all what I get when I save my changes.

Any idea what I'm doing wrong ? Is this a bug ?
I'm using this on Firefox 126.0.1.


