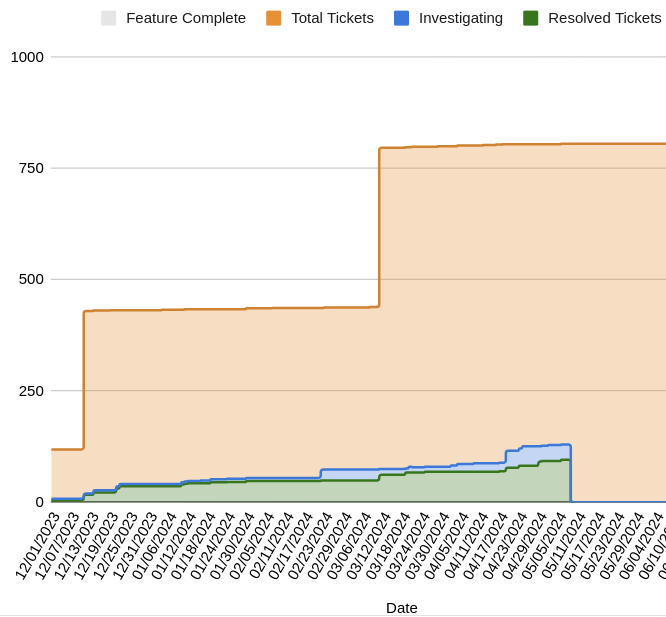
We use a particular graphic to show project history and status. Currently we're building it with a google-sheets plugin but it's really brittle to do it that way. I'm wondering/hoping if Jira can simply produce what I want natively.
The chart I want has an x-axis of Date. On the y-axis we plot shaded areas that represent the total number of tickets in a given state (submitted, investigating, resolved, etc) on that date.
Example desired output: