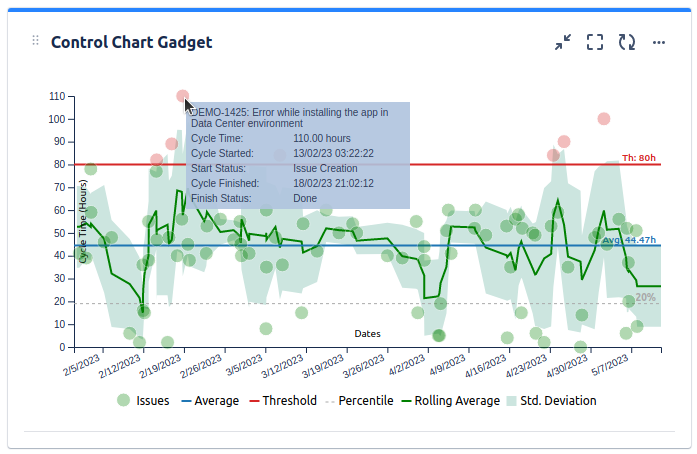
Please tell me if it is possible to get percentile graphs of SLA details in Service Management or Software project?
Hi @Irina Harutiunian
It is possible in JSM project reports. You need to choose 'your sla name - % met".
I don't see other options.
Regards,
Seba
Can you please explain how does "your sla name - % met" report work? Do I understand correctly that it shows the percentage of incidents in sla?
Hi!
You need to create custom report in JSM project. How to do that you can check here - https://support.atlassian.com/jira-service-management-cloud/docs/create-a-new-custom-report/
When you will add new series you will be able to choose %met for JQL that you want.
It's possible to use the SLA Time and Report add-on for Jira.
Steps to realize this:
1. Go to Dashboard and create a new one:
2. Choose the access type: Public or Private.
3. Add a gadget to a Dashboard:
4. Choose a Pie Chart:
5. Configure it according to your needs:
6. That’s all! 🎉 Get a ready-generated Pie Chart Gadget.
The application has a 30-day trial period and is free for small teams (up to 10 users), so you can check how well it suits you. My team developed it so our support team can help you with the settings
Hi @Irina Harutiunian,
With our Great Gadgets app you can display SLAs charts with percentiles.
See section #4 in this article for more details: https://community.atlassian.com/t5/App-Central/An-effective-dashboard-for-Service-Desk-and-Customer-Support/ba-p/2360369
If you have questions, please feel free to email us at support@stonikbyte.com.
Hope this helps.
Danut.
It looks like you're new here. Sign in or register to get started.