Hi All,
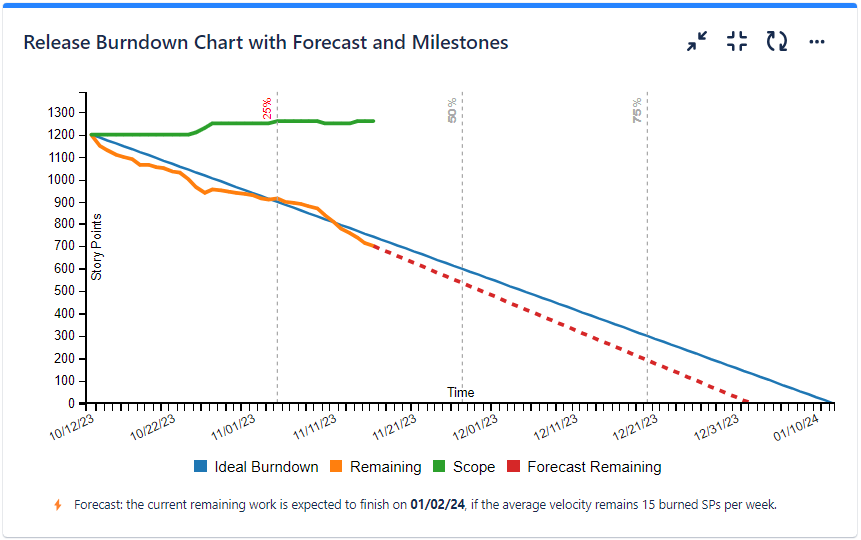
Today I've been trying to create a specific burn-down/up chart with some customized field. I know within reports and burn down gadget it does the trick, but it does not support custom fields. Hence, the reason why I'm trying to achieve a similar graph with custom field instead of 'story point'. I have my reasons for that, that is not why I seek help.
I'm trying to use 'JavaScript Charts for Jira Cloud', there is even an example for burn down. Despite that, I'm failing to create the graph I want... The gadget field seems to show some JQL error, while I assembled the JQL using the issue finder. It works there, so I assume no issue. The gadget even has an JQL editor, even my query is working fine.
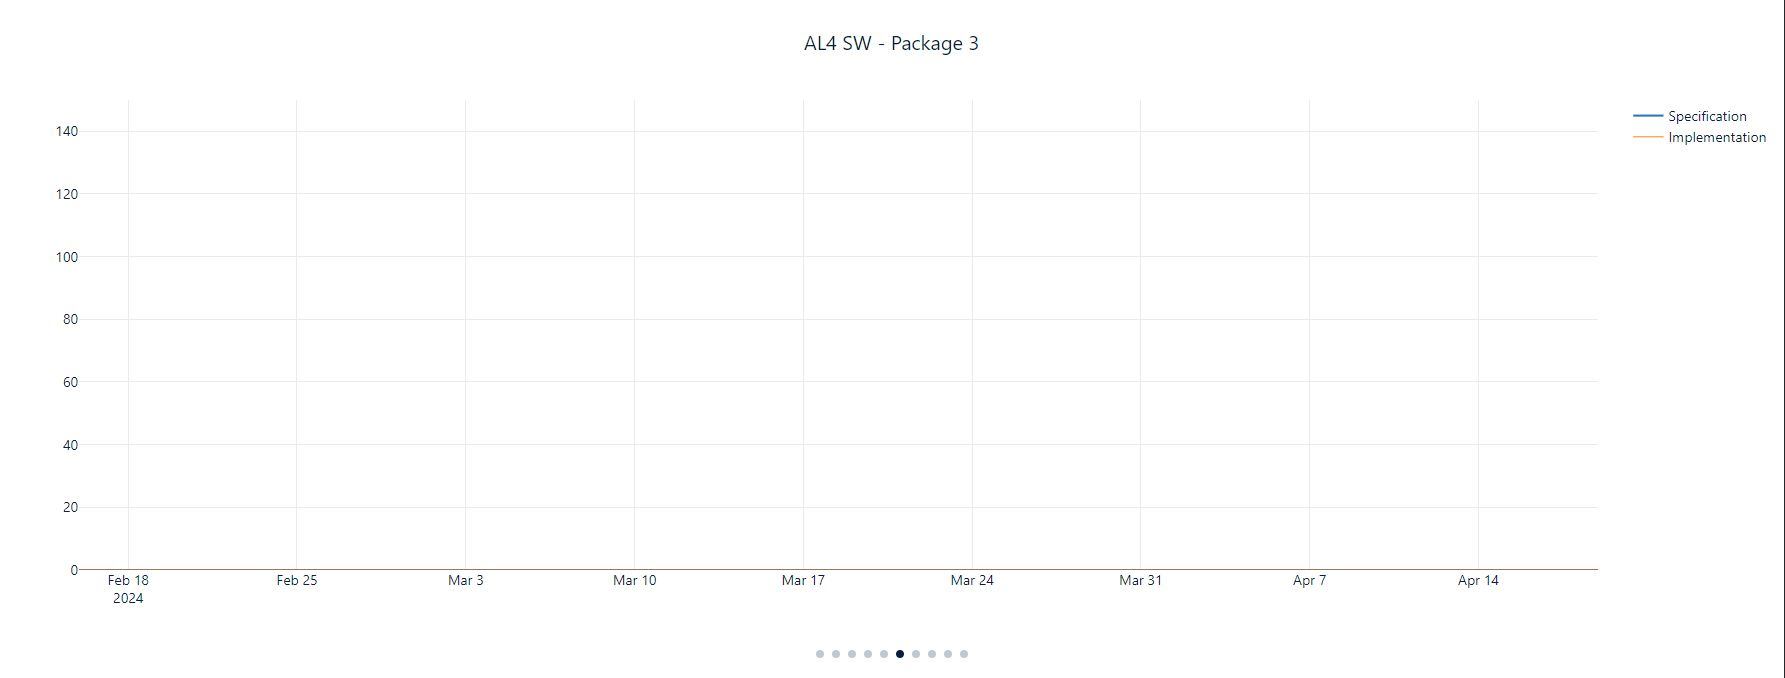
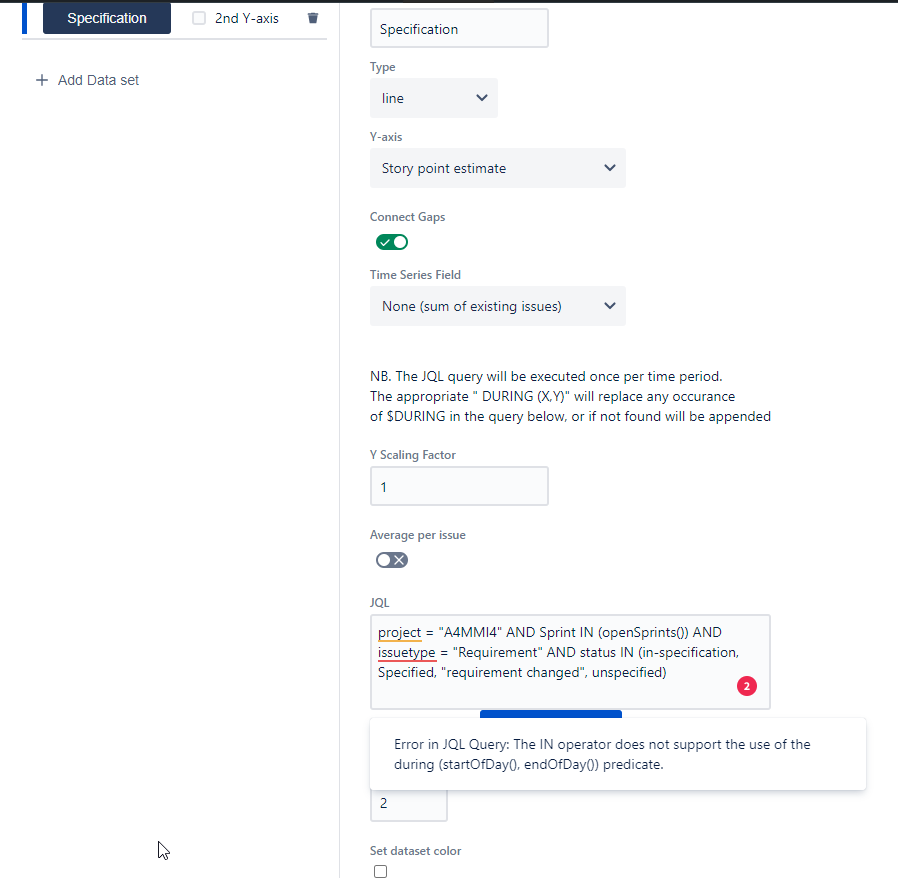
The result is always the same, nothing is shown on the graph, while the JQL field is return the following error:
Error in JQL Query: The IN operator does not support the use of the during (startOfDay(), endOfDay()) predicate.
Used JQL:
project = "A4MMI4" AND Sprint IN (openSprints()) AND issuetype = "Requirement" AND status IN (in-specification, Specified, "requirement changed", unspecified)