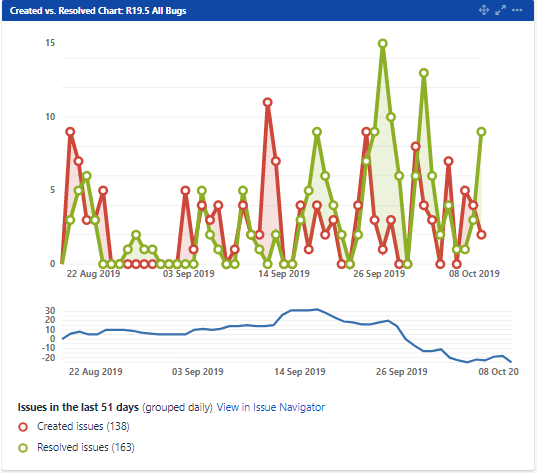
Why does it seem that the Display the Trend of Unresolved does not corelate to cumulative flow diagram?
The cumulative flow diagram seems to have an upward trend while the Display the Trend of Unresolved goes up and down
Filter: project in (xx, yy) AND issuetype in (Bug, Issue, Task) AND status not in (Done) AND (labels is EMPTY OR labels not in (Backlog)) ORDER BY key ASC
Thinking about this further is it because the Display the Trend of Unresolved is a daily value, meaning if on Oct 8, Created was 10 and Resolved was 12 the blue line would be at plotted at -2 for that day. Then this is confusing as we have had days where the resolved is higher than the created but the cumulative flow diagram does not show the dip.