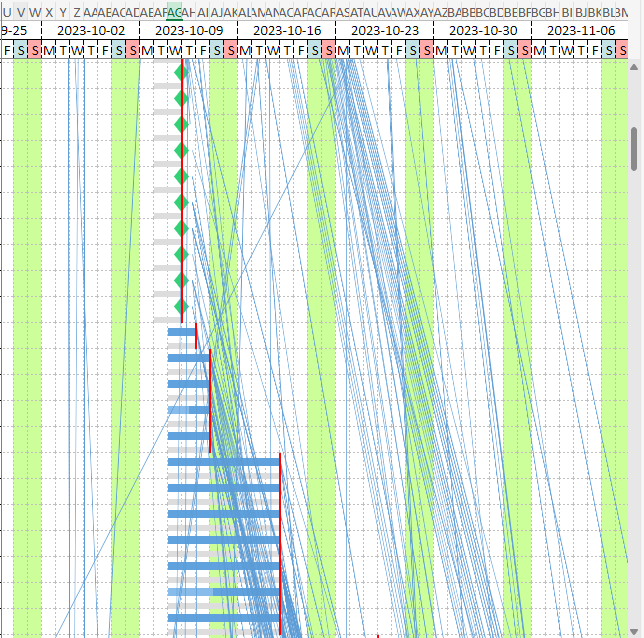
I am trying to download the excel report from wbs gantt chart but the excel report that appear is very messy which looks as follows (screenshot added). I am aware that the gantt chart settings can be figured but how do we configure the settings for excel report we are exporting from gantt chart. As you can see the blue lines in there are making it very messy, i am not sure what they represent and would like to remove them. Can you please guide?


![Photo of Raphael Nascimento [Ricksoft Inc.]](https://us.v-cdn.net/6038660/uploads/avatars/b8/1b/nb81b728bdad30ad95dd6bfc97f731045.png)