I want to add the Burnup Chart and Velocity Chart report to the Jira dashboardHow can I do this?
Hi @delaram nezami
Unfortunately these gadgets aren't available; there are feature requests for both though you could vote for; check out:
You might be able to achieve this with an App though, which extends dashboard features. Check out Apps such as...
Ste
Hi @delaram nezami,
Your best option here is our Great Gadgets app. This app offers a complete set of dashboard gadgets for tracking agile projects in an effective manner: sprint burnup / burndown, release burnup / burndown with forecast, velocity chart, cycle time, lead time, CFD, WIP, wallboard, etc.
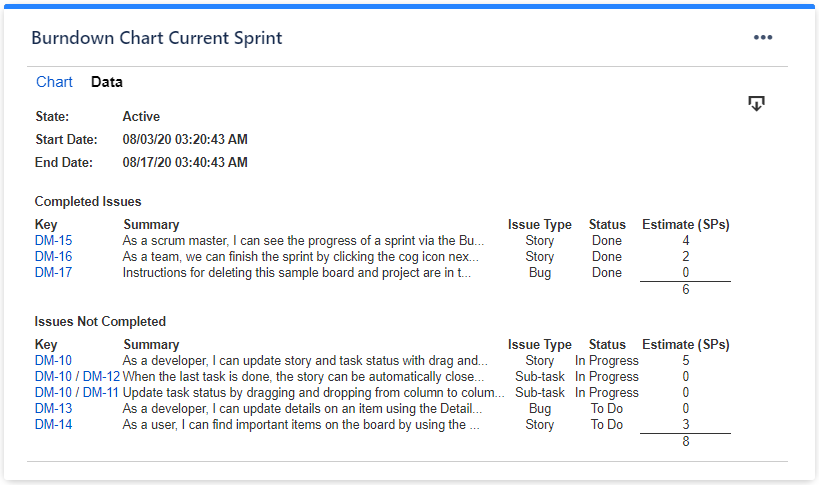
Most of these gadgets offer also a Data tab with a detailed report that you can easily export in CSV. Here is just an example.
Just have a look over the articles from our blog to see how many things you can track with this app. It can be a great asset for your team/company.
If you need any help, please contact support@stonikbyte.com.
Thank you,
Danut Manda
It looks like you're new here. Sign in or register to get started.