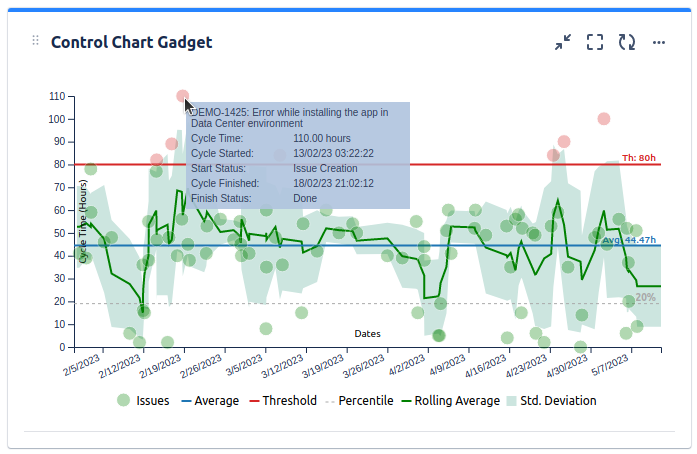
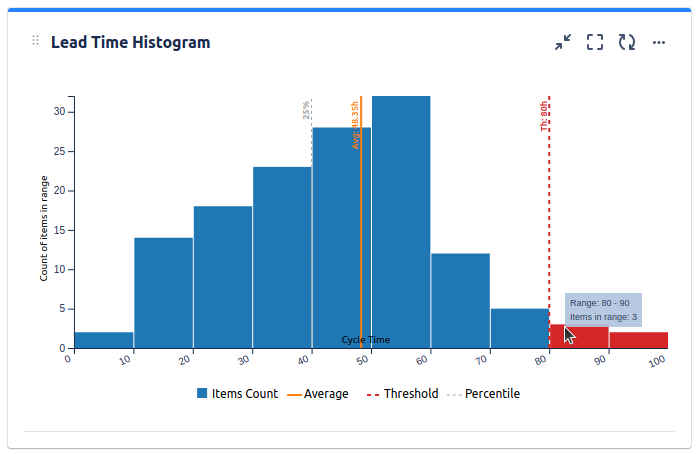
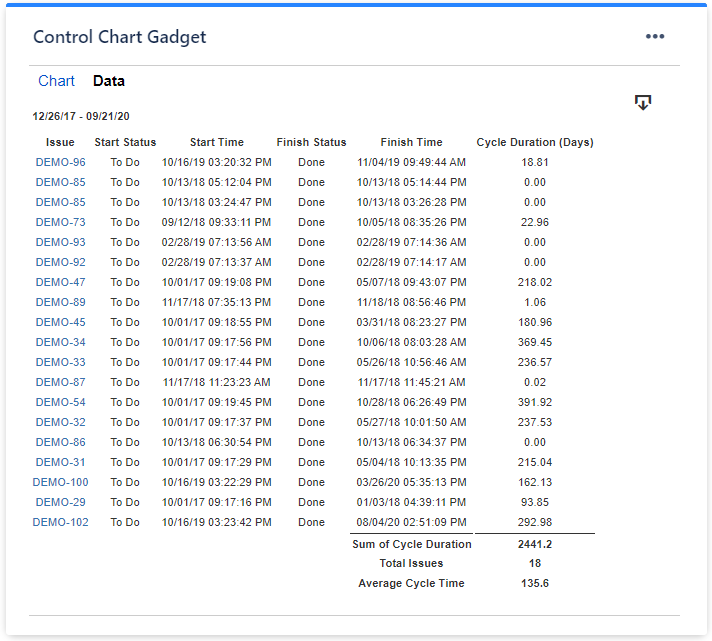
My management(IT team) have a requirement to show minimum, maximum and average story lifecycle.
I have checked Jira dashboard, there is an existing dashboard called: "Average Age Chart", after testing I found this chart counts average start from story create to done status, however, most of stories are created since business have an idea, they may take a long time before are assigned to IT teams, so our "Start time" shall be when assign to IT team(We defined a status in workflow for this action).
Now my question is, how can I customize an existing dashboard to define the start/end, and to pick out minimum/maximum in a month? We have IT team so if there is way for script development then we may be able to do more.





![Photo of Emre Toptancı [OBSS]](https://us.v-cdn.net/6038660/uploads/avatars/88/25/n8825d1e863017fd80882ab56e7550387.png)


