Hello team, i require TAT report and SLA report to understand the resolution time, SLAs met and SLAs breached
Go to Project > Reports > Custom > SLA Met vs Breached, Time to Resolution, SLA Success Rate
Hi @Jyotika Patil,
You can better measure these metrics with the gadgets offered by our Great Gadgets app.
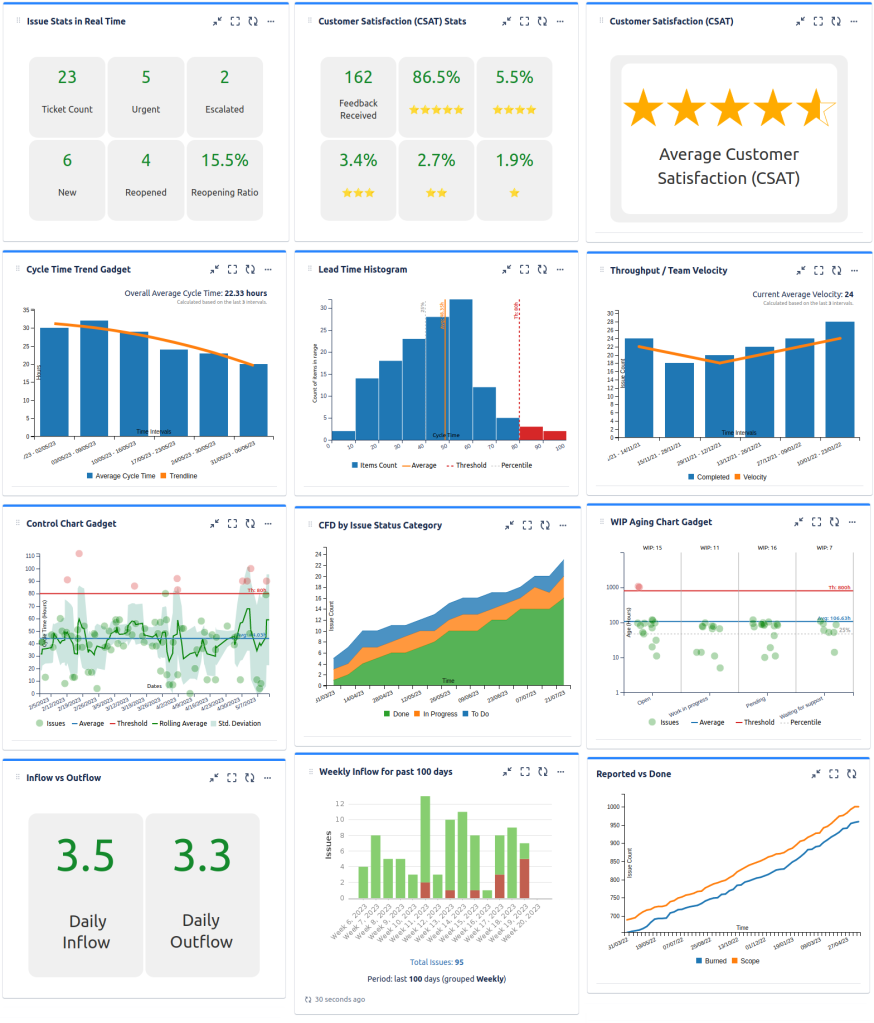
See this article on how to create a powerful dashboard for Jira Service management: An effective dashboard for Service Desk and Customer Support teams in Jira Service Management.
More specifically, for identifying the tickets that breached the SLA, these two gadgets can be very useful.
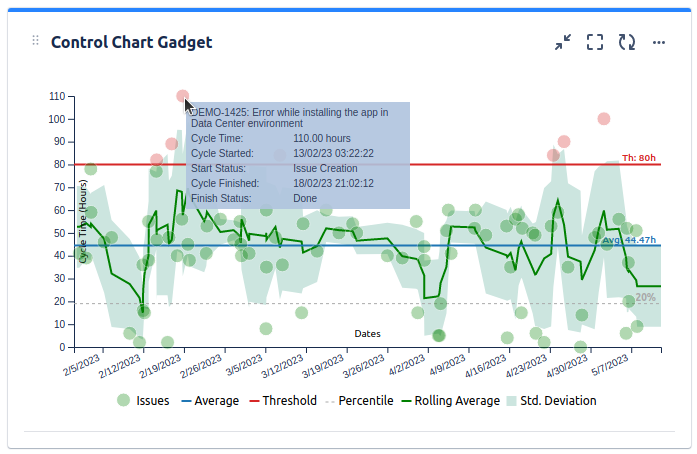
Control Chart - this displays the issue by their SLA (defined as time between workflow states, configurable in gadget settings). You have the option to set a threshold, so that the chart can highlight the issues that breached the SLA.
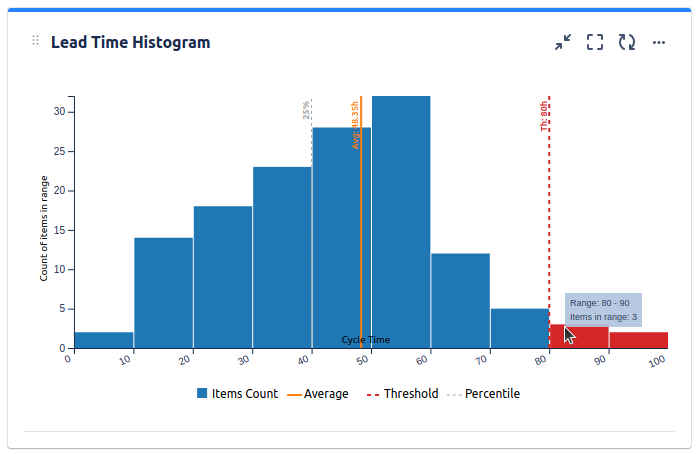
Histogram Chart - display the issues by their SLA, showing how many breached the SLA
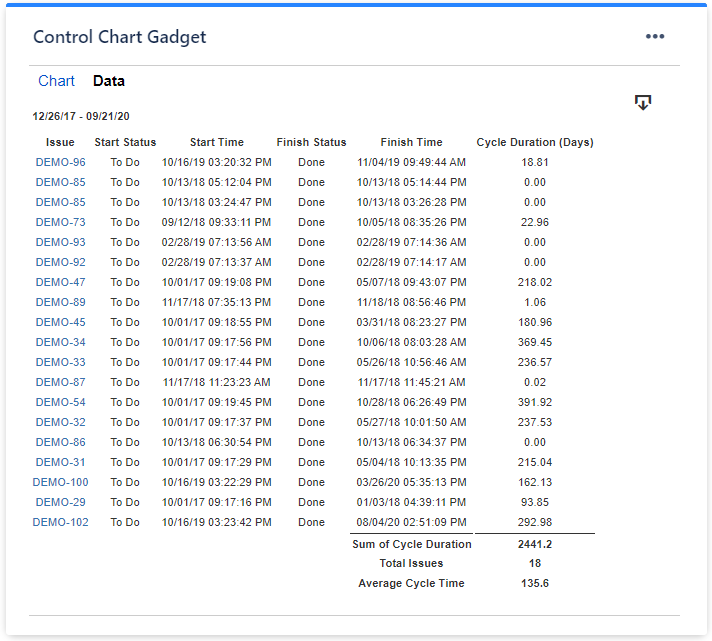
These gadgets offers also a Data tab with a SLA report that you can export in CSV.
Similar to this, you should be able measure the TTR. if you need help, please contact us at support@stonikbyte.com.
Note that our Great Gadgets app offers many other gadgets for JSM. It could be a great asset for your team and company.
Hope this helps.
Danut.
It looks like you're new here. Sign in or register to get started.