Hello,
Checking to see if there is a gadget in Jira Cloud compatible to Cycle Time Trend Gadget from Jira Sever/Data Center. If not is there a JQL I can use to get the same results in a Dashboard.
Thank you
Hi @lapacquah_bryant ,
Unfortunately there is no built-in way of getting Cycle Time in Jira Cloud. JQL does not provide cycle time calculation. You either need a marketplace app or Jira automation.For more information about cycle time you can check the article belowCycle Time and Lead Time in Jira
Thank you @Mehmet A _Bloompeak_ any suggestions as to how to write the Jira Automation. I did not see any actions for cycle time but logging work or log action?
Is this the only way to get a start and stop time for completing an issue/ticket for JSM project.
You should populate 2 custom fields. One for storing the progress start time and one for the storing the cycle time.
Now all the done issues will have a CycleTime field populated.
After setup of custom fields, then I can create an automation rule, however how do I get a report?
Hi @lapacquah_bryant,
When it is about measuring the cycle time, lead time or time between any workflow statuses, our Great Gadgets app can be of great help.
It offers some dashboard gadgets that allow measuring cycle time and display it in different ways.
Cycle Time as Trend Chart - allows you to see the average cycle time for past time intervals and displays the trend
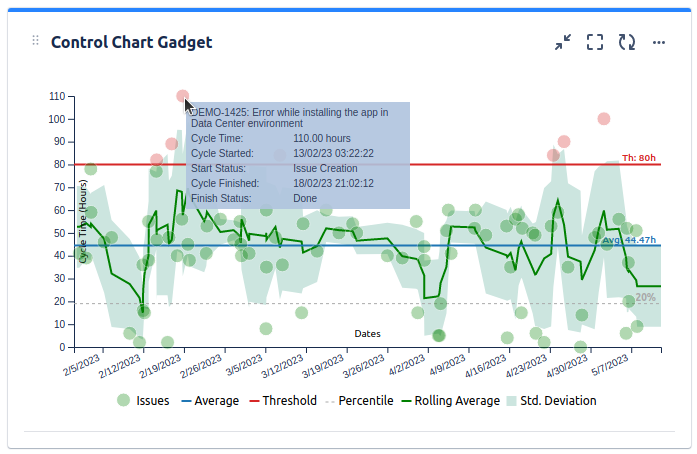
Cycle Time as Control Chart - see the issues by their cycle time and easily identify the one that took longer than expected
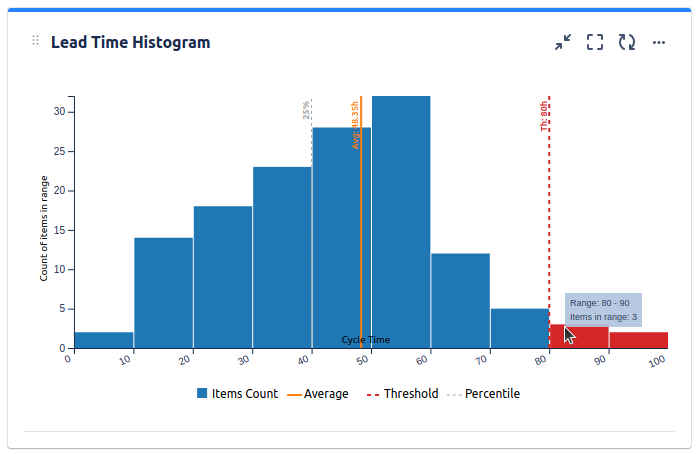
Cycle Time as Histogram Chart - see how many issues were in each range and how many took longer
Have a look over these articles on our blog to see what you can track with our app and how:
I hope this helps. If you have any questions, please don't hesitate to contact us at support@stonikbyte.com.
Thank you,
Danut
Thank you for the follow up we cannot use apps at this time.
Hello @lapacquah_bryant ,
The closest you can get with out-of-the-box Jira is the Control Chart (which is available as part of Kanban Board reports). However, Control Chart offers limited details and flexibility. For maximum details and flexibility, I suggest you use a marketplace app (I know you said you can't use an app at this point but perhaps you change your idea in the future or others reading this post might benefit from this answer)
Our team at OBSS built Timepiece - Time in Status for Jira exactly for this. It is available for Jira Server, Cloud, and Data Center.
Time in Status mainly allows you to see how much time each issue spent on each status or each assignee.
You can combine the time for multiple statuses to get metrics like Issue Age, Cycle Time, Lead Time, Resolution Time etc.
For all numeric report types, you can calculate averages and sums of those durations grouped by the issue fields you select. For example total in-progress time per customer or average resolution time per sprint, week, month, issuetype, request type, etc. The ability to group by parts of dates (year, month, week, day, hour) or sprints is particularly useful here since it allows you to compare different time periods or see the trend.
The app calculates its reports using already existing Jira issue histories so when you install the app, you don't need to add anything to your issue workflows and you can get reports on your past issues as well. It supports both Company-Managed and Team-Managed projects for Jira Cloud.
Time in Status reports can be accessed through its own reporting page, dashboard gadgets, and issue view screen tabs. All these options can provide both calculated data tables and charts.
Here is the marketplace page for Time in Status by OBSS:
Timepiece - Time in Status for Jira
EmreT
Thank you @Emre Toptancı _OBSS_
It looks like you're new here. Sign in or register to get started.


![Photo of Emre Toptancı [OBSS]](https://us.v-cdn.net/6038660/uploads/avatars/88/25/n8825d1e863017fd80882ab56e7550387.png)


