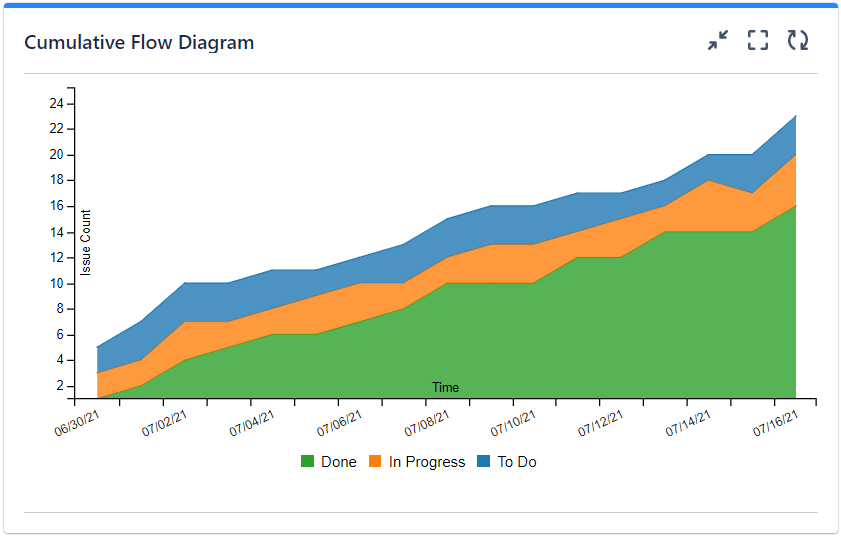
Really strange behaviour with the Cumulative flow diagram.
It shows negative values on x-axis (integratred on dashboard with gadget). But as there are no negative values (of course), the display of the other values just starts in the middle of the picture instead of the bottom. Unfortunately the x-axis can't be configured. Any ideas how to solve this?