Hi,
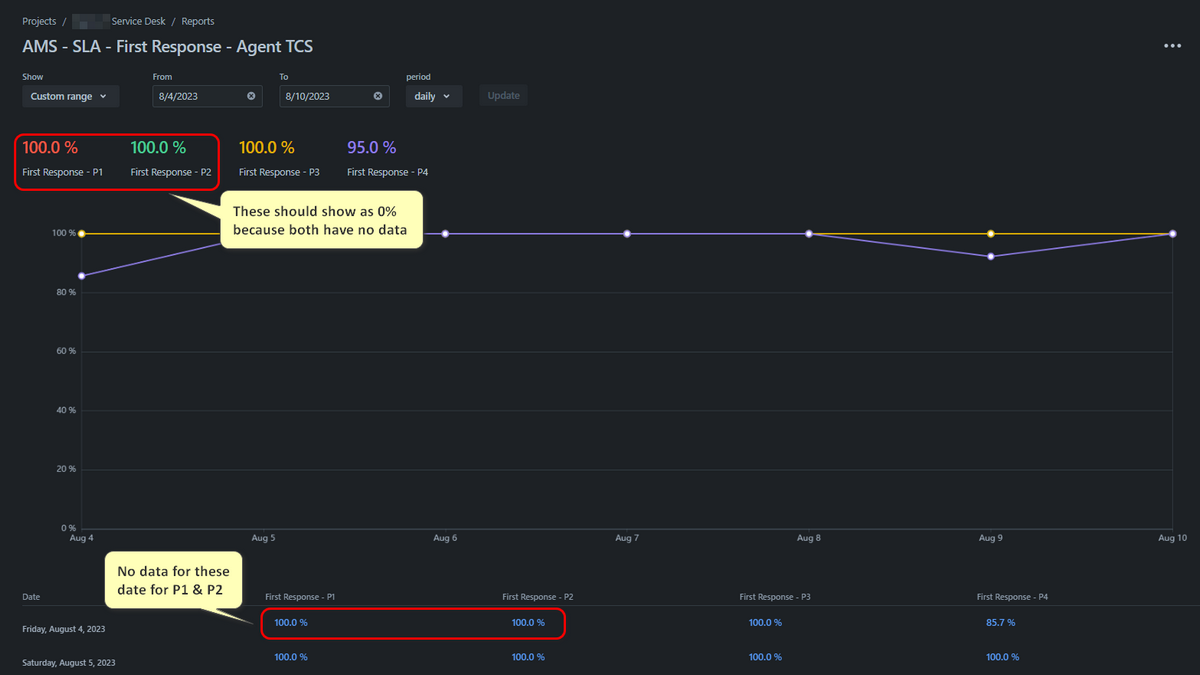
Our team created a report for First Response broken down by priority (i.e., P1, P2, P3, and P4).
The graph show correct data. But the summary total above and list below show P1 and P2 as 100% when there is no record for P1 and P2 during the selected date range?
How can I show 0% in the summary and the list if now data returned in the filter?
Thanks,
Zaldy


