Hi all,
I have a need to show planned vs actual time in bar chart, is it possible?
-Syed KM
Hi @Syed Khwaja Moinuddin !
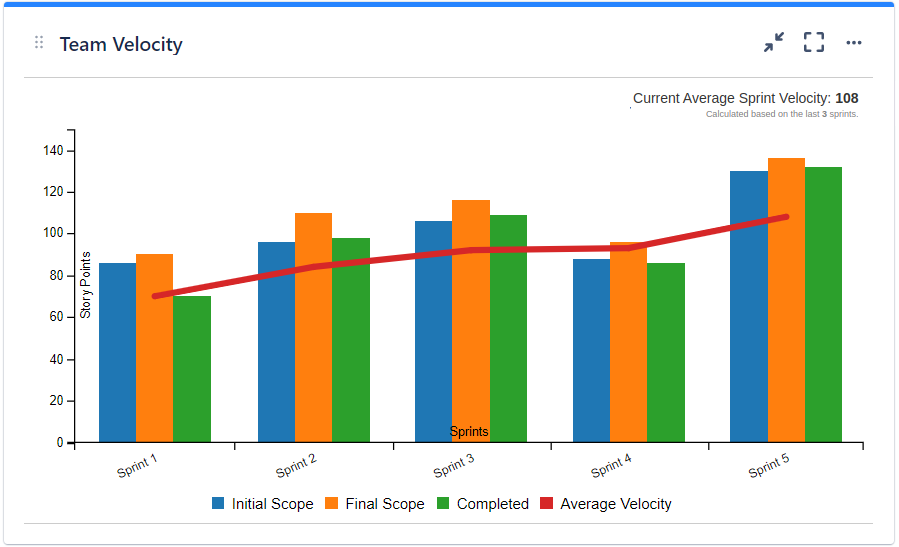
I believe the chart you are looking for is the Velocity Chart! This will show the amount of work committed vs completed for each sprint.
You can find this within your Jira project under Reports > Velocity Chart.
Here is a helpful article from Atlassian on how it works: View and understand the velocity chart
Hope this helps!
Hi @Syed Khwaja Moinuddin,
This article on our blog might be helpful for you: A powerful Reported vs Done chart for Jira dashboards
The gadget supports various calculation methods: by story points, time estimates, issue count or any numerical custom field. It is a line, not a bar chart, but it might address your needs.
This app offers many other gadgets that you will find useful, including a Velocity bar chart that you can use if you have sprints. In this example, Initial Scope is "planned", Current Scope is "actual panned" and Completed is "realized". The gadget is configurable, you can display only these two series.
If you have any questions, please contact us at support@stonikbyte.com.
Thank you,
Danut Manda
It looks like you're new here. Sign in or register to get started.