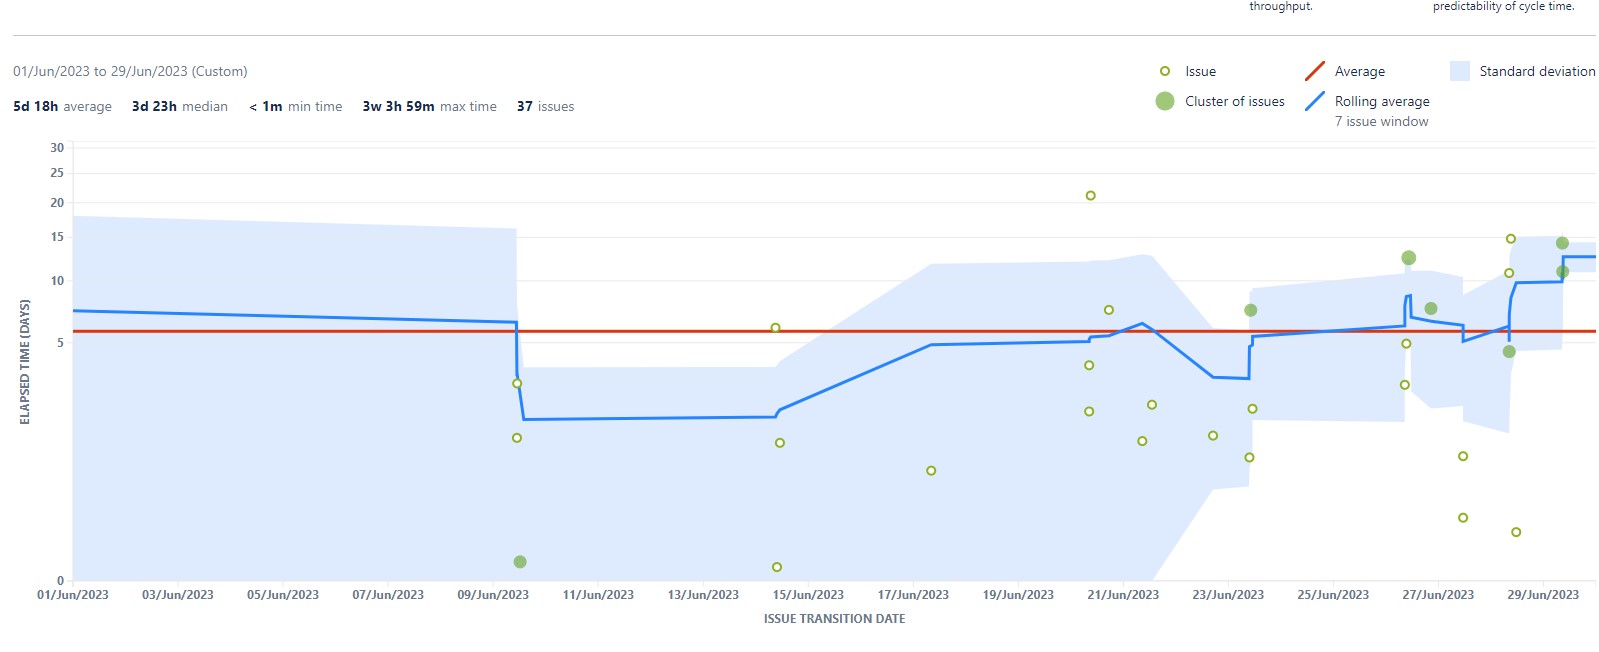
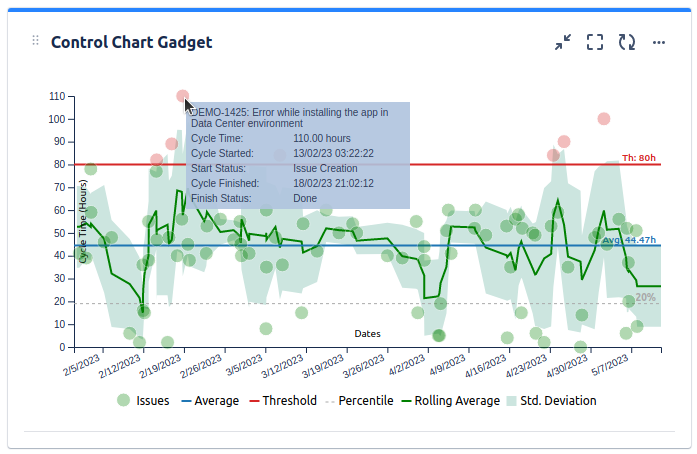
Hey team - having an issue when using our control chart. It will not show the shaded area for the Standard Deviation unless I highlight the chart. This makes it difficult for screenshots and reporting when you're missing your predictability.
Either I'm colour blind which someone here can confirm for me, or I have a setting on my browser that I'm missing. I've had other people view this and can't see it either.
Any help would be appreciated.