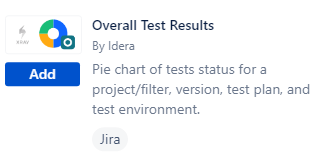
In creating a Dashboard, I select this option:
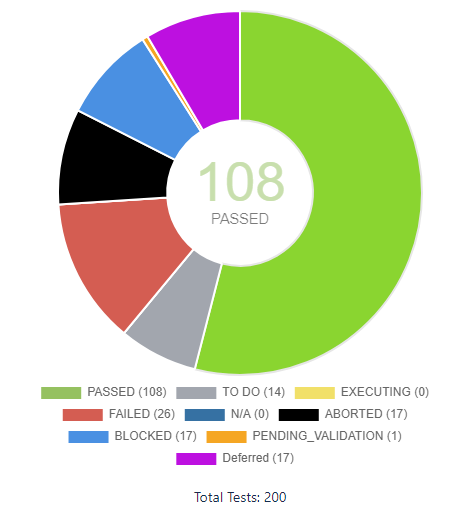
I then configure it to use a filter of Test Cases, and the resulting pie chart looks like below. The total count (200) matches the number of Test Cases in the filter, so I know that's a view of Test Cases, however I cannot find a way to show those statuses on a Test Case report. In reality, those statuses actually align to Test Runs, and my assumption is that the pie chart is taking the status of the latest Test Run on any given Test Case to derive the Test Case status in this form. Does anybody know the field name of that status so I can use it in a tabular report? Or is it possible it's calculated on the fly and not available elsewhere? If I choose Status in a tabular report, I only see Open/Closed values (the true Test Case-level Status), and that's not what we are interested in.